
If you’re working with large-scale, real-time, or historical datasets in Microsoft Fabric, Eventhouse is a game-changer. It’s designed for managing both streaming and batch data, enabling you to store, query, and analyze data at scale without juggling multiple tools.
In this guide, we’ll walk through what Eventhouse is, why you should use it, and—most importantly—how to work with it step-by-step.
Try to understand what is an Eventhouse in Microsoft Fabric
Eventhouse is a data store within Microsoft Fabric’s Real-Time Analytics environment. It’s optimized for handling both streaming data (coming from sources like IoT devices, telemetry systems, or event hubs) and historical data (coming from databases, files, or warehouses).
Key Features:
- Real-time ingestion from streaming platforms (Event Hubs, IoT Hub, Kafka).
- High-performance queries with a Kusto Query Language (KQL)-based engine.
- Scalable storage for petabytes of data.
- Integration with the Fabric ecosystem—connect directly to Power BI, Data Factory, and Synapse pipelines.
Simple Term:
A central hub where high-speed, high-volume data flows in, is stored in a structured way, and becomes instantly available for querying and analytics.
Why Use Eventhouse?
Eventhouse shines in scenarios where you need fast, scalable analytics without worrying about managing infrastructure.
Use Cases:
- IoT analytics—processing millions of sensor readings in real time.
- Clickstream analysis—tracking user behavior on websites or apps.
- Log and telemetry analysis—debugging and monitoring at scale.
- Fraud detection—real-time analysis of transactions.
- Operations monitoring—keeping an eye on KPIs with instant alerts.
Benefits:
- Handles both batch and streaming data in one environment.
- Lower latency for analytics compared to traditional warehouses.
- Native integration with Microsoft Fabric, Power BI, and Azure services.
Getting Started with Eventhouse
Let’s walk through the setup process.
Create an Eventhouse in Microsoft Fabric
- Go to the Microsoft Fabric workspace.
- Click New → Real-Time Analytics → Eventhouse.
- Give it a name, select your workspace, and set capacity.
- Click Create.
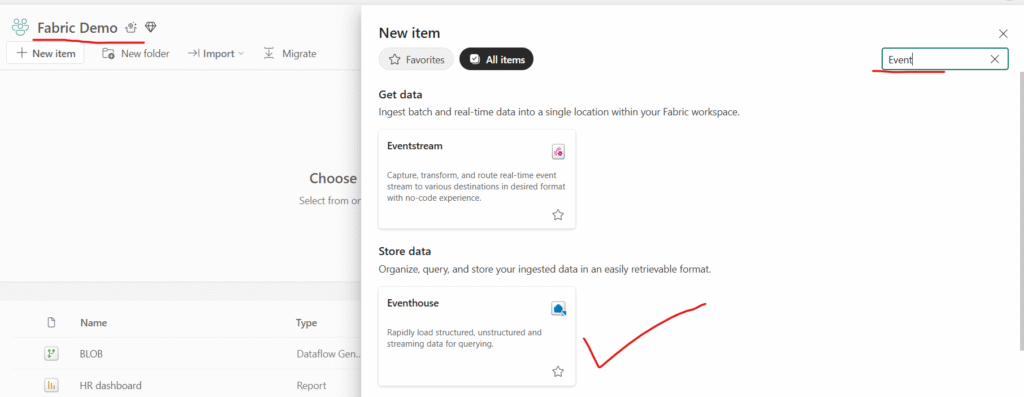

Once created, Eventhouse will contain one or more databases to organize your tables.
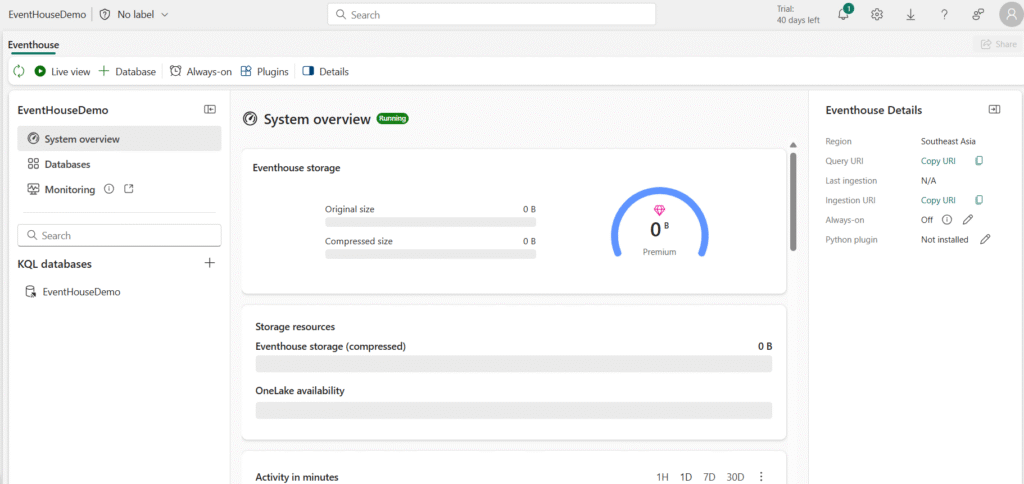
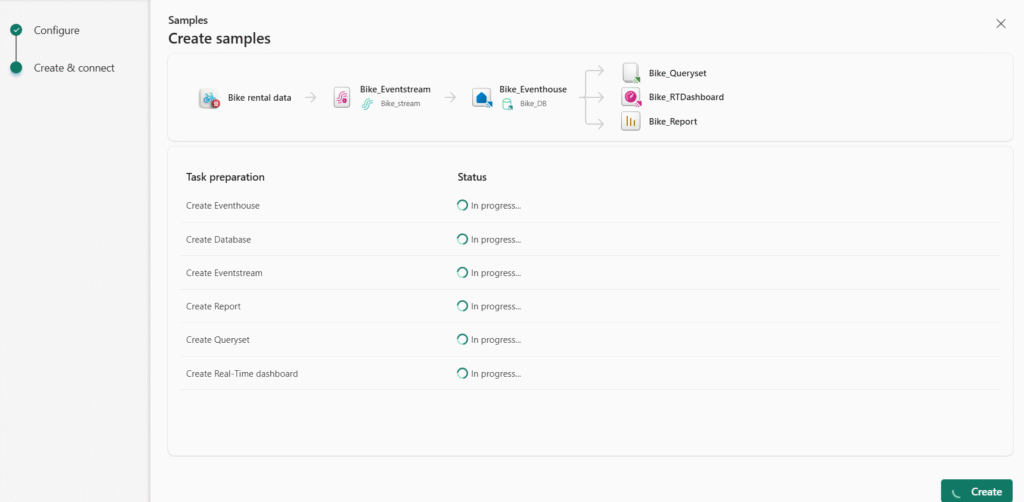
- In the menu bar on the left, select Workloads. Then, select the Real-Time Intelligence tile.
- On the Real-Time Intelligence home page, select the Explore Real-Time Intelligence Sample tile. It will automatically create an eventhouse called RTISample:

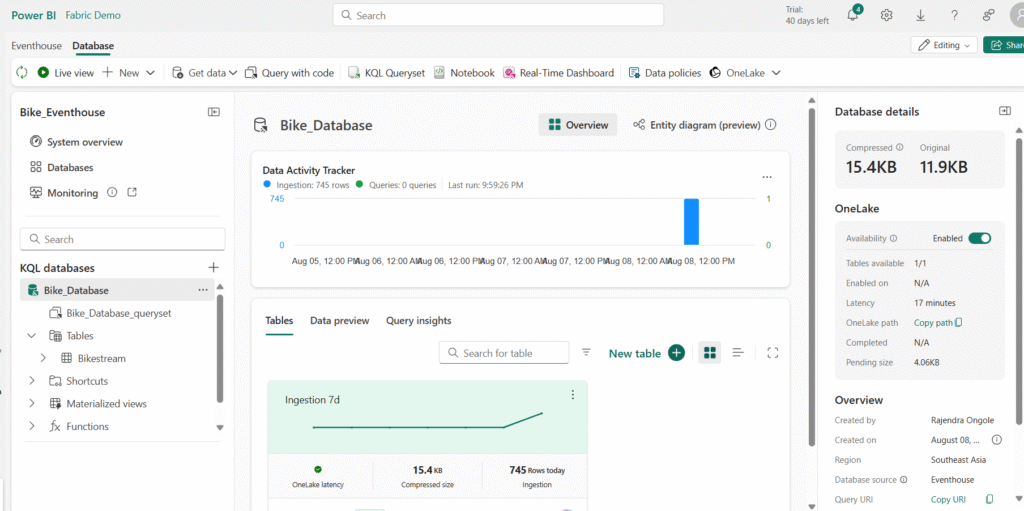
In the pane on the left, note that your eventhouse contains a KQL database with the same name as the eventhouse.
- Verify that a Bikestream table has also been created.
Query data by using KQL
Kusto Query Language (KQL) is an intuitive, comprehensive language that you can use to query a KQL database.
Retrieve data from a table with KQL
In the left pane of the eventhouse window, under your KQL database, select the default queryset file. This file contains some sample KQL queries to get you started.
Modify the first example query as follows.
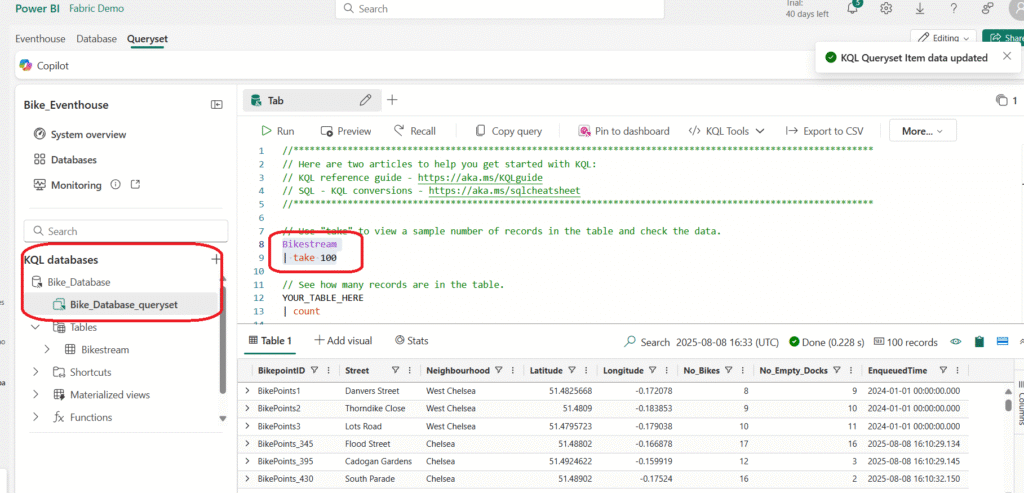
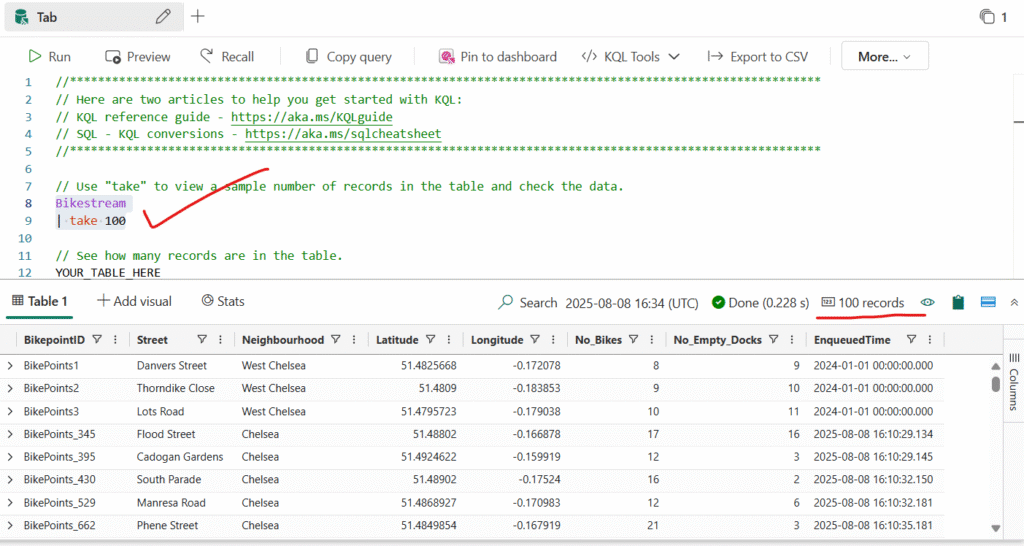
The Pipe ( | ) character is used for two purposes in KQL including to separate query operators in a tabular expression statement. It is also used as a logical OR operator within square or round brackets to denote that you may specify one of the items separated by the pipe character.
Select the query code and run it to return 100 rows from the table.
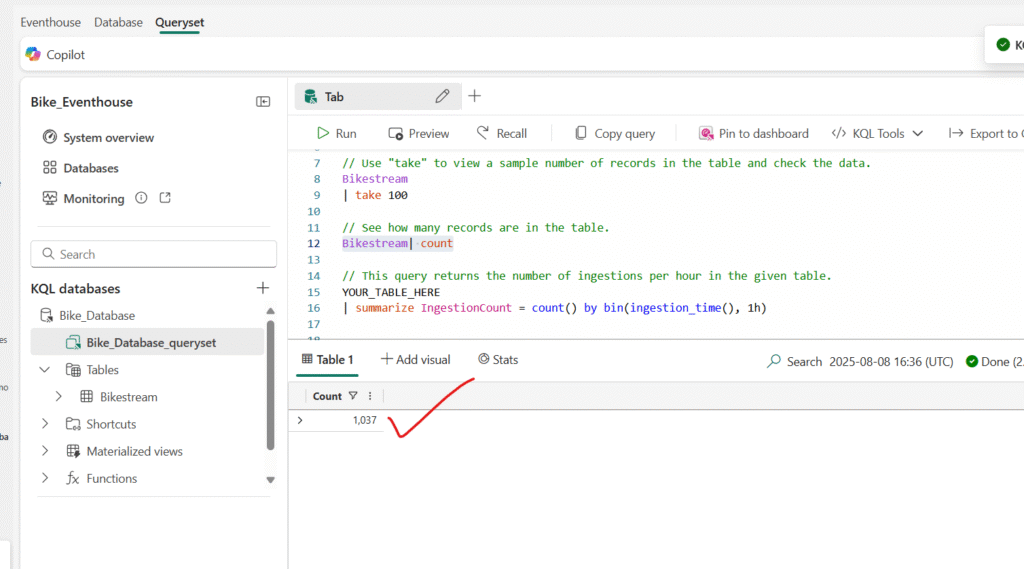
Type, select, and run the following query: Count of records:
You can be more precise by adding specific attributes you want to query using the project keyword and then using the take keyword to tell the engine how many records to return.
Type, select, and run the following query:
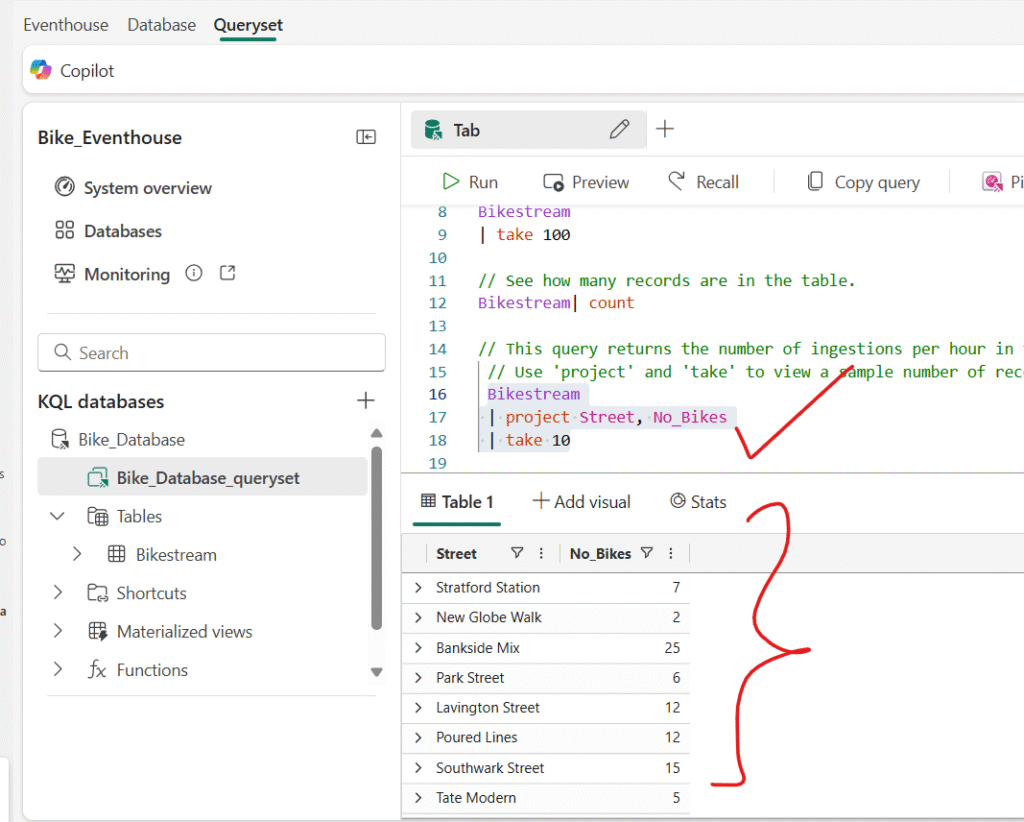
NOTE: The use of // denotes a comment.
Another common practice in the analysis is renaming columns in our queryset to make them more user-friendly.
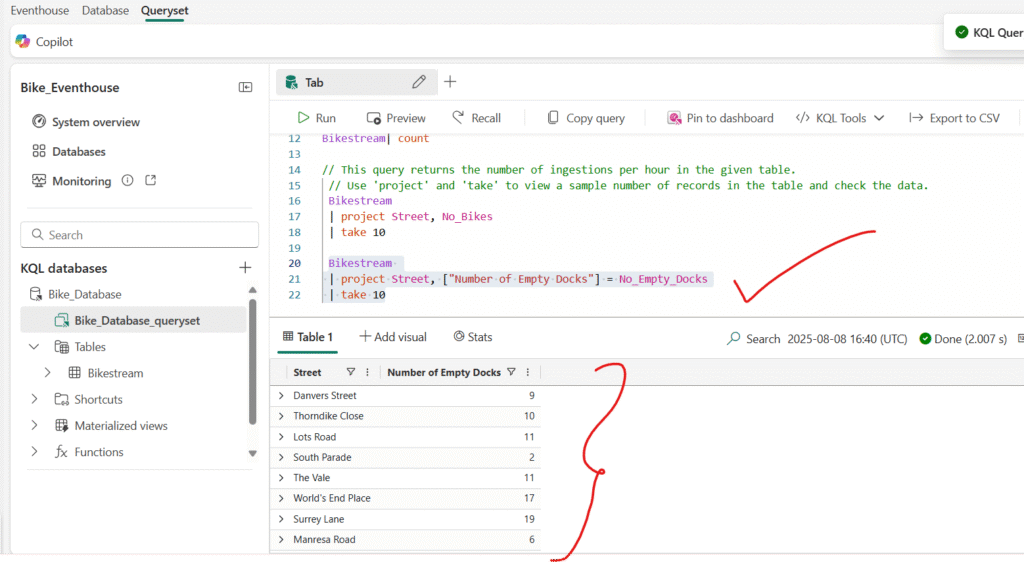
Summarize data by using KQL
You can use the summarize keyword with a function to aggregate and otherwise manipulate data.
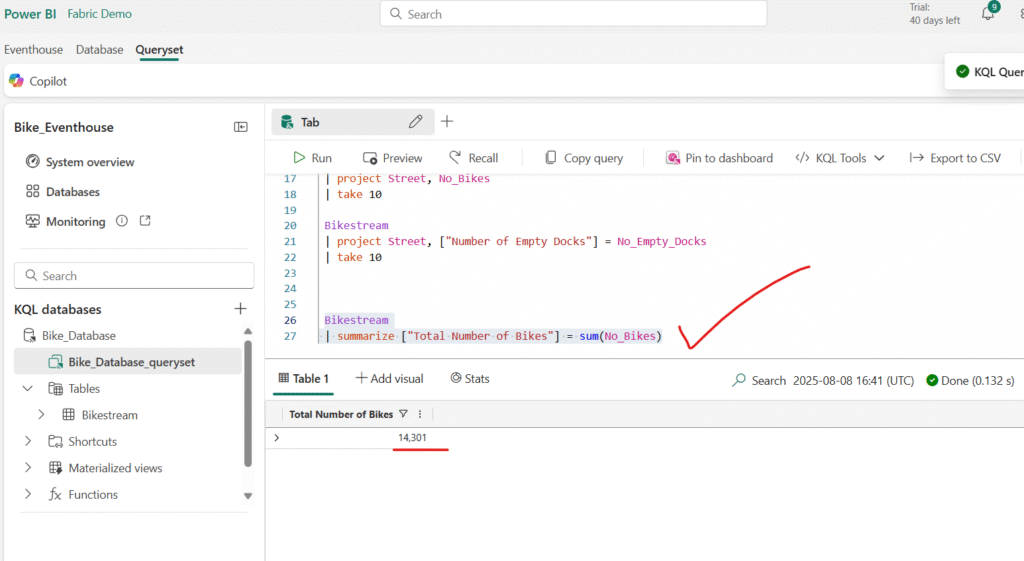
You can group the summarized data by a specified column or expression.
Run the following query to group the number of bikes by neighbourhood to determine the amount of available bikes in each neighbourhood:
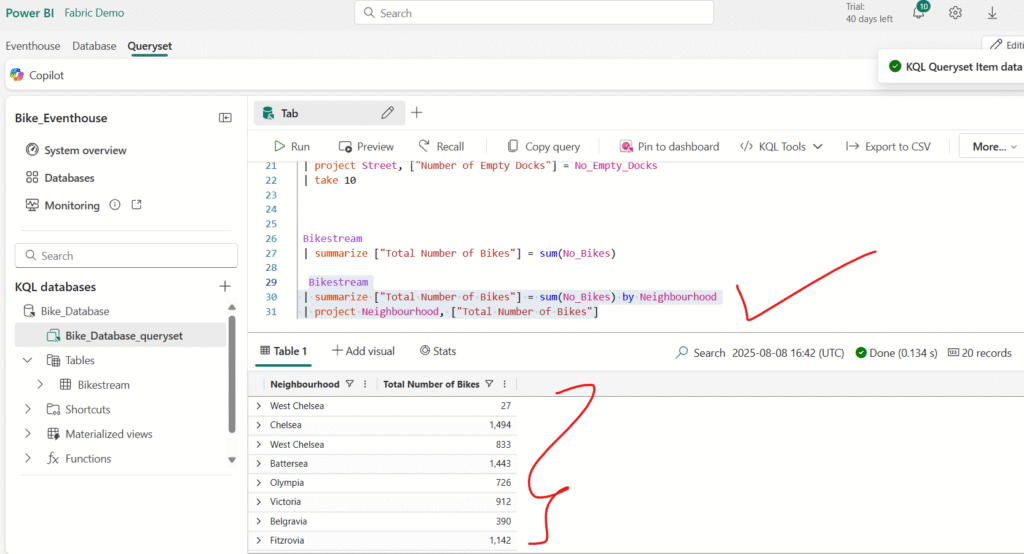
If any of the bike points has a null or empty entry for neighbourhood, the results of summarization will include a blank value, which is never good for analysis.
Modify the query as shown here to use the case function along with the isempty and isnull functions to group all trips for which the neighbourhood is unknown into a Unidentified category for follow-up.
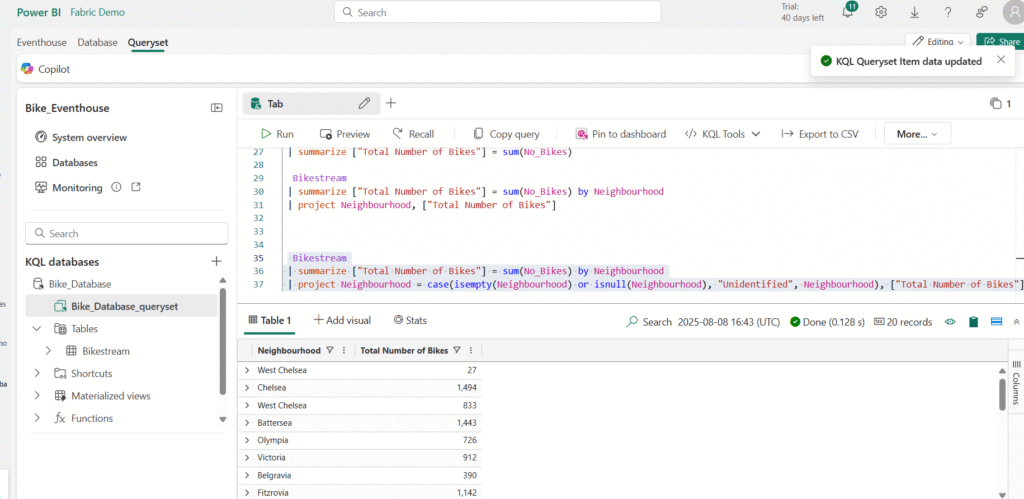
Note: As this sample dataset is well-maintained, you might not have an Unidentified field in the query result.
Sorting Data with KQL
To better understand our data, we often need to arrange it in a meaningful order. In Kusto Query Language (KQL), this is done using the sort by or order by operator — both work the same way.
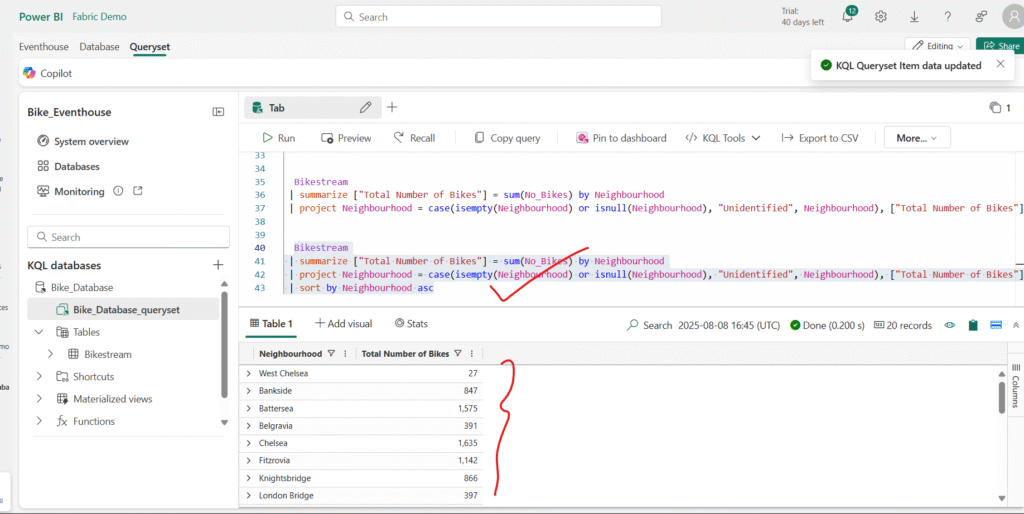
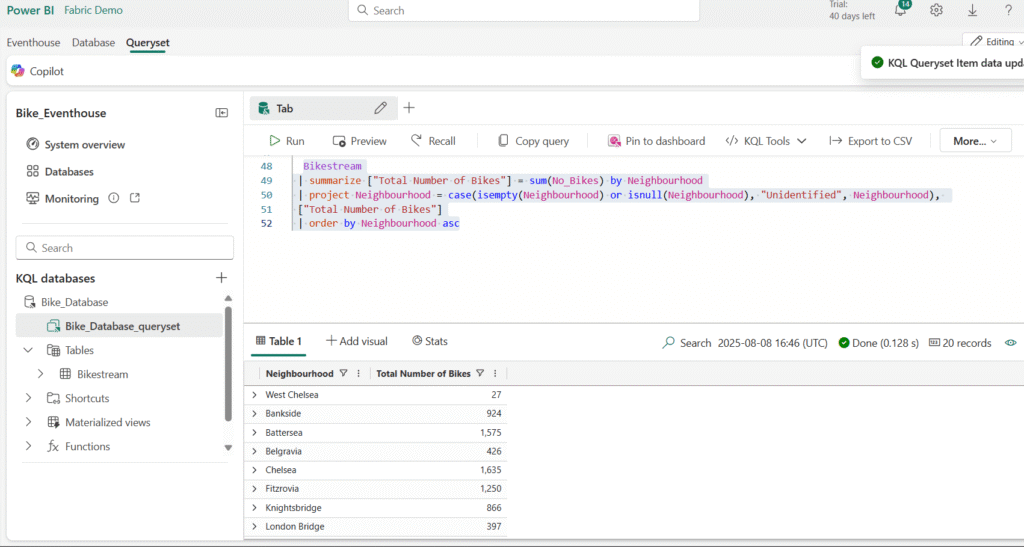
Modify the query as follows and run it again, and note that the order by operator works the same way as sort by:
Filtering Data with KQL
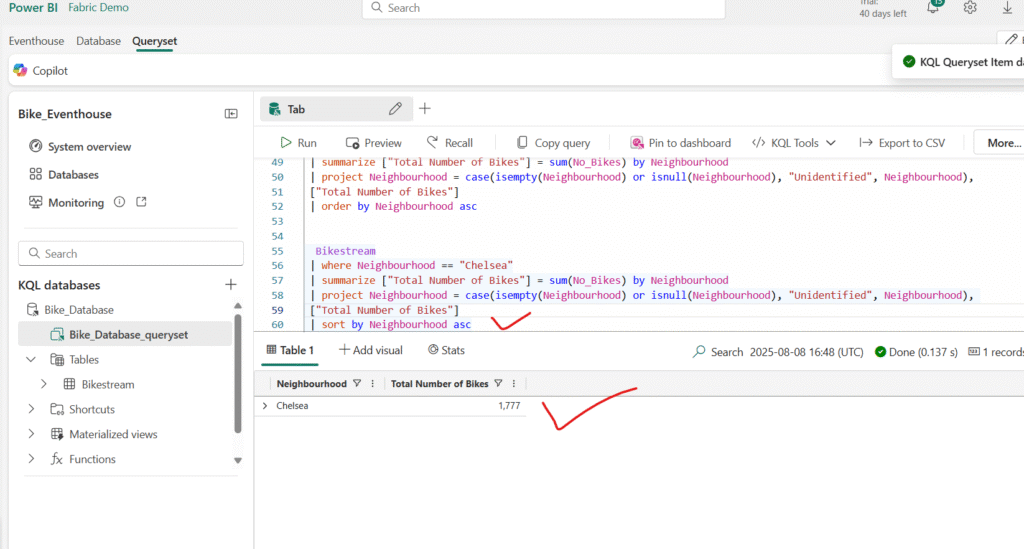
In Kusto Query Language (KQL), the where clause is used to filter data. You can combine multiple conditions in a where clause using the logical operators and and or.
For example, run the following query to filter the bike data so it only includes bike points located in the Chelsea neighbourhood:
Querying Data with Transact-SQL
A KQL Database doesn’t natively support Transact-SQL (T-SQL), but it provides a T-SQL endpoint that emulates Microsoft SQL Server. This allows you to run T-SQL queries on your data, mainly for systems or tools that don’t support KQL directly.
However, the T-SQL endpoint has limitations compared to SQL Server:
- You can’t create, alter, or drop tables.
- You can’t insert, update, or delete data.
- Some T-SQL functions and syntax aren’t supported if they’re incompatible with KQL.
The T-SQL endpoint exists primarily for compatibility, but KQL should be your primary query language when working with a KQL Database, as it offers greater performance and capabilities.
That said, you can still use certain SQL functions supported by KQL—such as COUNT, SUM, AVG, MIN, and MAX.
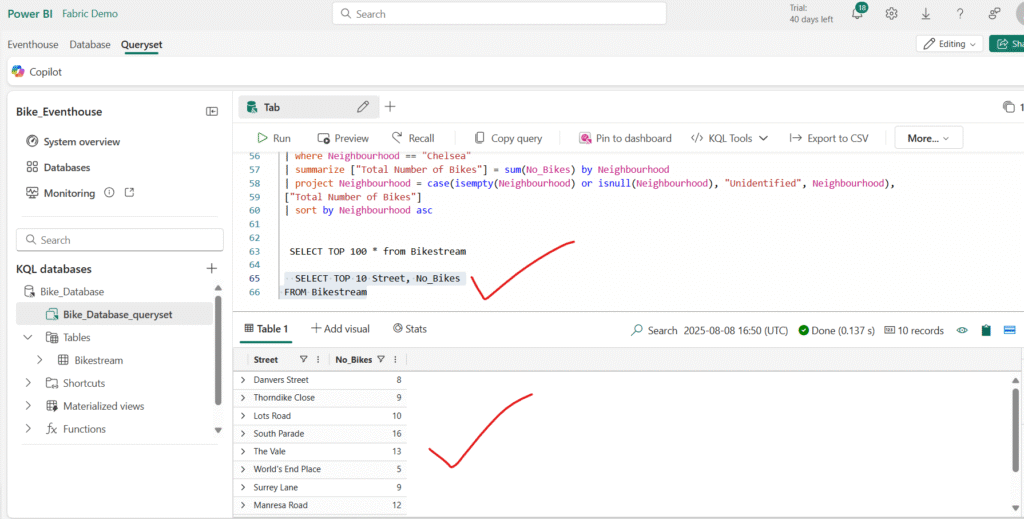
Retrieve data from a table by using Transact-SQL
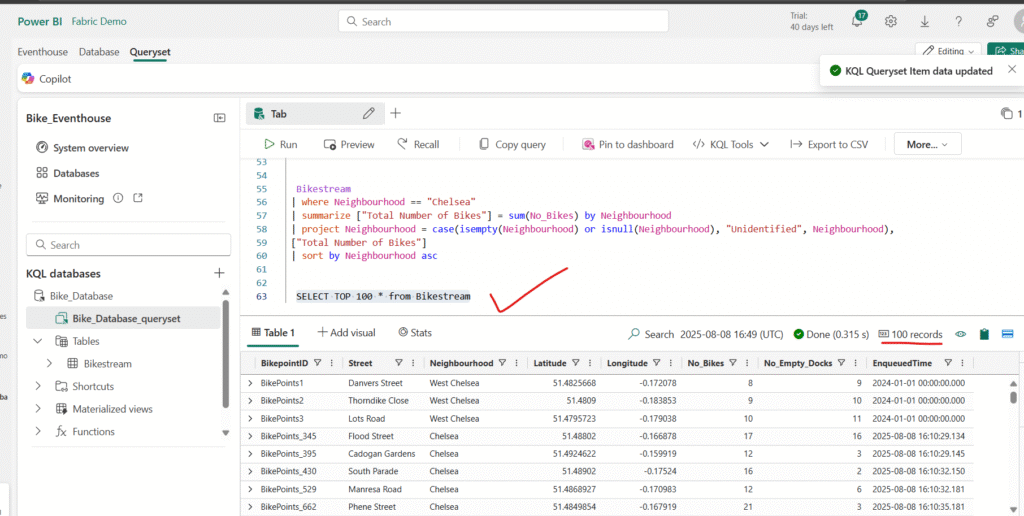
Modify the query as follows to retrieve specific columns
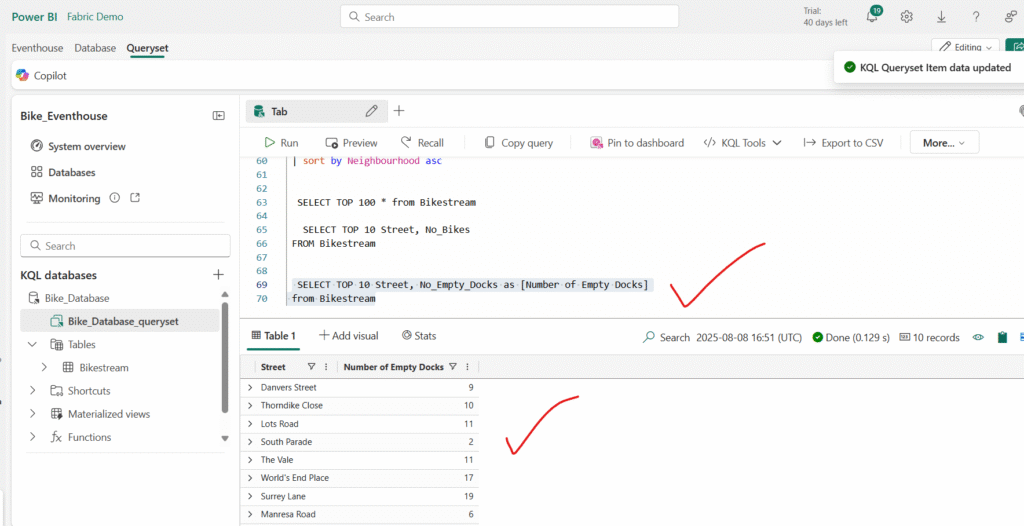
Update the query to assign an alias that renames the No_Empty_Docks column to a more user-friendly name.
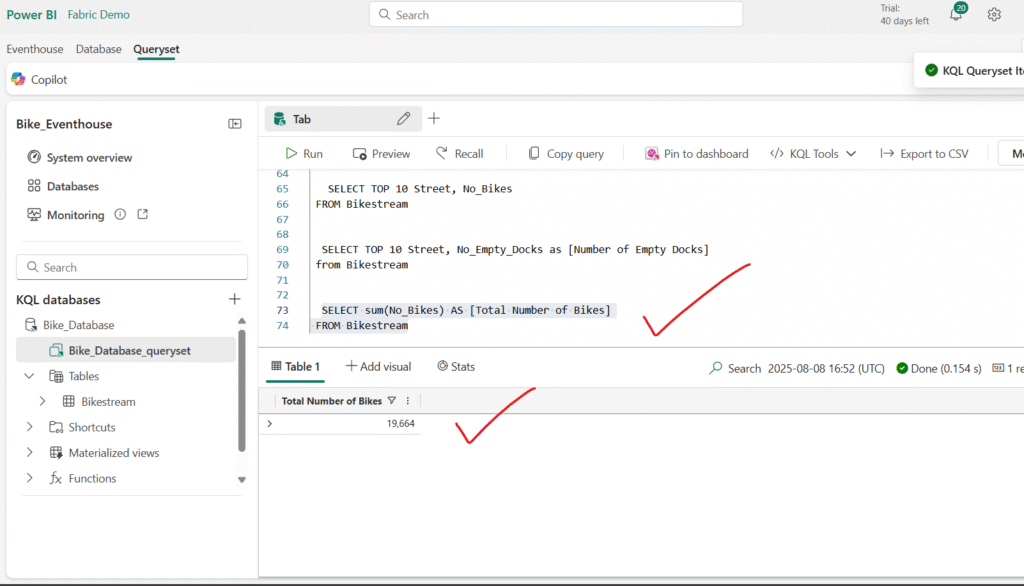
Summarizing Data with Transact-SQL
In Transact-SQL (T-SQL), you can summarize data using aggregate functions such as COUNT, SUM, AVG, MIN, and MAX. These functions are often combined with the GROUP BY clause to produce aggregated results for specific categories or groups within your data.
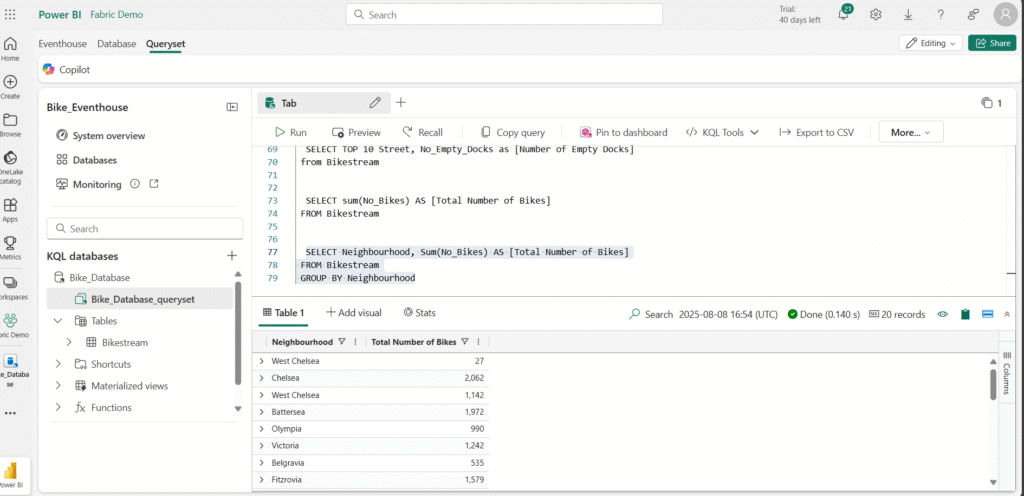
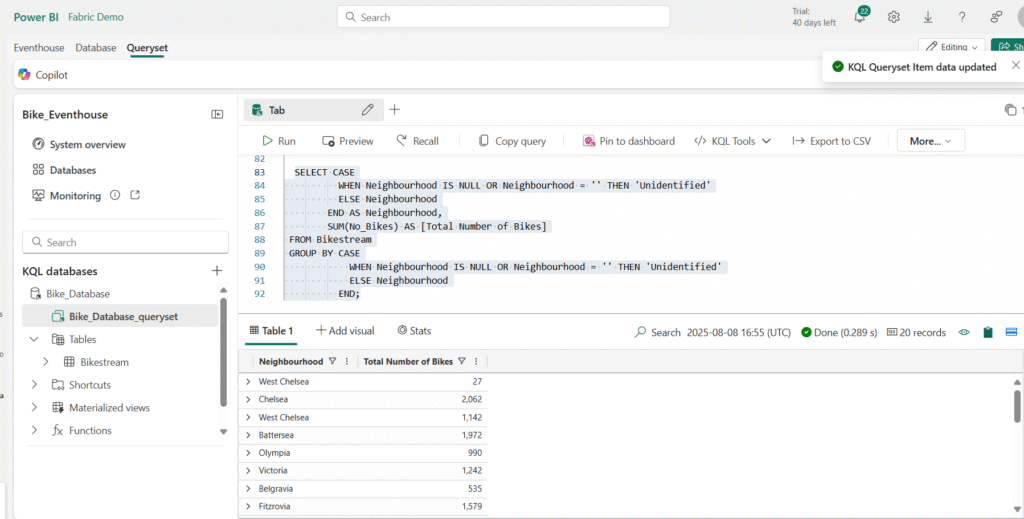
Modify the query to group the total number of bikes by neighbourhood:
Using a CASE Statement to Categorize Data
Enhance the query by adding a CASE statement that groups bike points with an unknown origin into an “Unidentified” category for follow-up.
Filter data by using Transact-SQL
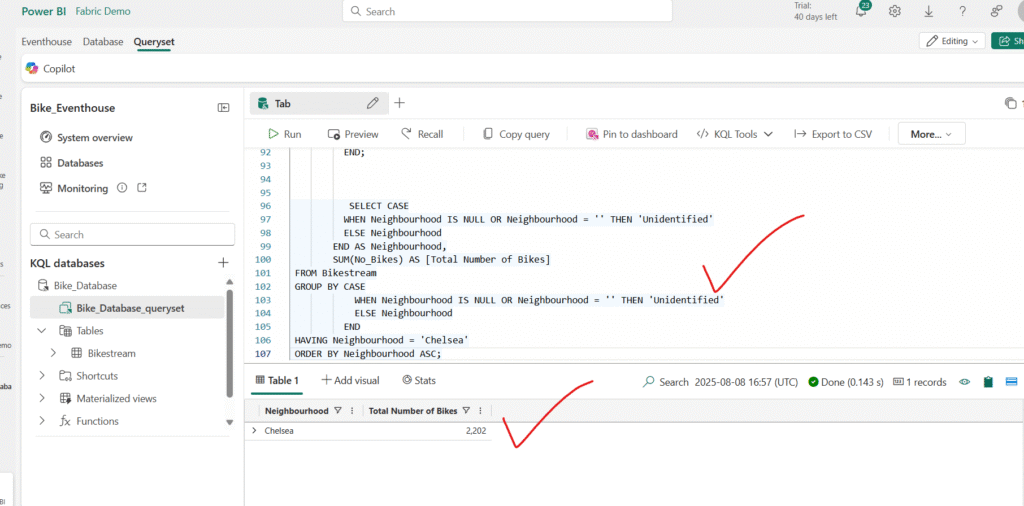
Run the following query to filter the grouped results so that only rows where the neighbourhood is “Chelsea” are included.
Wrapping Up
Microsoft Fabric’s Eventhouse is more than just a storage solution—it’s a real-time, analytics-ready powerhouse. With the ability to ingest, store, query, and integrate data seamlessly, it removes the friction between raw data and actionable insight.
Whether you’re building IoT dashboards, monitoring transactions, or analyzing user behavior, Eventhouse lets you do it all in one place.
Happy Read!!
Hope you like this post!!
