Power BI Mastery Program
Course Overview:
Unlock the power of data with Power BI, Microsoft’s leading business intelligence tool. This 10-week structured program is designed to take you from the basics of data visualization to advanced analytics techniques using real-world datasets and hands-on projects.


Time:
2 Hours/Day (Live Sessions)

Level:
Beginner to Intermediate

Schedule:
Saturdays & Sundays

Duration:
10 Weeks

Mode:
Online & Interactive
Weekly Schedule:
Each weekend includes 4 hours of live instruction and guided practice (2 hrs Saturday + 2 hrs Sunday).
Course Curriculum Breakdown:
- Understanding BI & Data Visualization Concepts
- Power BI Desktop Overview
- Installing & Setting Up Your Environment
- Connecting to various data sources
- Cleaning, transforming, and shaping data
- Data types, filters, and applied steps
- Relationships between tables
- Star vs Snowflake schema
- Introduction to DAX
- Calculated columns vs Measures
- Common DAX functions (SUM, AVERAGE, IF, CALCULATE)
- Time intelligence basics
- Bar, Line, Pie, Map, Card, and KPI charts
- Custom visuals and formatting best practices
- Interactions and drill-downs
- YTD, MTD, QoQ, YoY calculations
- Ranking, filtering, and dynamic measures
- DAX performance tips
- Designing a responsive layout
- Bookmarks, tooltips, and buttons
- Slicers and filters
- Publishing reports to Power BI Service
- Workspaces, sharing, and collaboration
- Data refresh and scheduled updates
- Implementing RLS
- Workspace roles and permissions
- Deployment pipelines (basic intro)
- Real-world business dashboard project
- Final Q&A and walkthrough
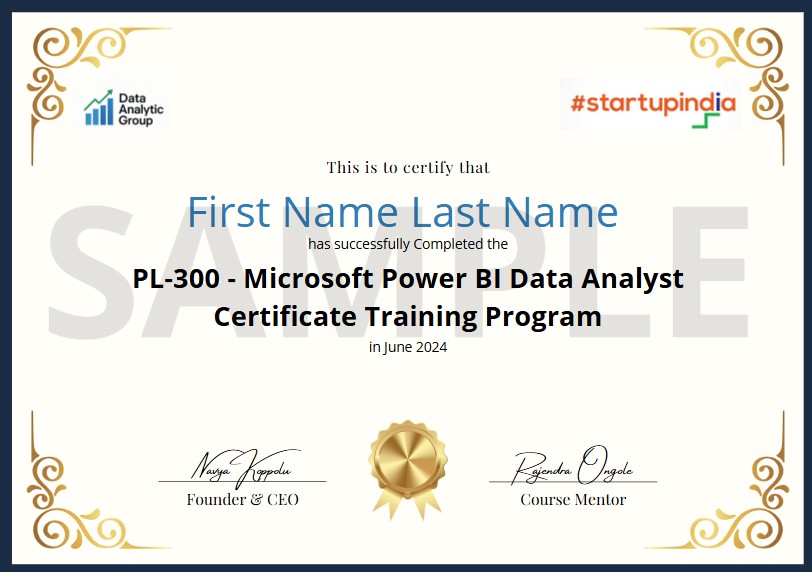
- Certification of Completion
What You'll Gain:
Hands-on experience with real data
Strong portfolio project
Resume-boosting certification
Weekend flexibility with live expert sessions
Community support and mentorship
Certification

Interested?
Join the Data Analytic Group’s Power BI Mastery Program and take the next step in your data career.

