
A what-if parameter in Power BI allows you to create dynamic scenarios and analyze their impact on your data. By defining a parameter, you can easily adjust values and see how they affect your visualizations and insights in real-time.
In any data analysis project, whenever we analyze data, we always want to find out some what-if scenarios. For example, what if sales increased by 10%, or what if we decreased item cost by 1%?
These what-if analyses can be very helpful for any decision-making process.
Power BI has an AI-driven feature that enables us to implement these what-if scenarios. This is known as What-If Parameters.
Here , we are going to explore this functionality with examples.
Get Data
For this scenario, I consider the sales dataset and the file location available in the below path.
Let’s start with the Get Data option under the Home tab. Extract data from the Excel workbook option from the quick connections.
• Select the file named US Superstore data. xlsx
•
• After selecting the file,
• Data will be displayed in the below format
• Click on Load and save data.

Where to find What-if Parameter tab?
By default
It is having below parameters inside
What-if Parameters:
•
• Name of the what-if parameter
• Data type (Whole number (Default), Decimal number, Fixed decimal number)
•Minimum
•Maximum
• Increment
• Default: a value used for the what-if parameter when no value is selected in the slicer.
• Add slicer to this page default selection

Create Discount/Markup What if Parameter
1. Create one what if parameter and provide the below information.
2. Name → “Discount Range,” Data type → Decimal number, Minimum → 0, Maximum → 1, Increment → 0.01
3. Click the check box for “Add slicer to this page.”
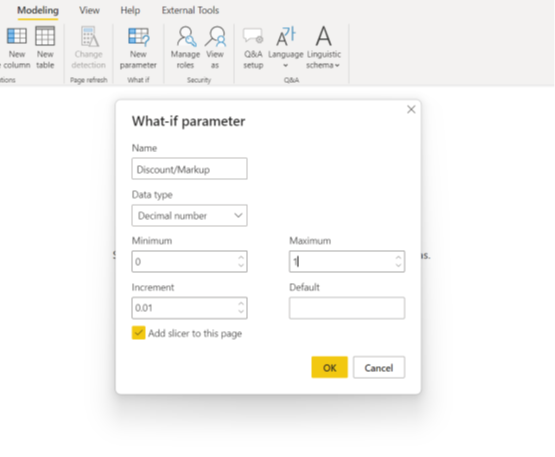
4. Click on the “OK” button, and two things will be added.
i) Created “Discount/Markup” table
ii) Added one slicer in the page as Discount/Markup.

What if a parameter is created, but you don’t know how you can use this in your project?
Let us find the application of this parameter.
1. Create one calculated measure to use this above parameter in your project.
2. Create the below measure under the “US Superstore data” table.
Updated Sales =
‘Discount/Markup’ [Discount/Markup Value] * SUM(Orders[Sales])

I have taken the Waterfall Chart under the Visualization pane.
4. Add Order Date Hierarchy in the Category section. Keep only the year and month.
5. Add a category field in the breakdown section.
6. Add revised sales in values.


Choose the above fields.

Save this report with What If parameter analysis in .pbix format.
Please share your comments if any