Unlocking the Power of Monitor Fabric Activity in the Monitoring Hub
In today’s complex IT environments, maintaining optimal system performance isn’t just important—it’s mission-critical. As organizations scale and their infrastructures become more interconnected, the ability to monitor and optimize every layer of operations becomes a necessity. This is where monitoring fabric activity in the monitoring hub comes into play.
This blog explores what Monitor Fabric activity is, why it matters, its key features, and how organizations can leverage it to enhance performance, security, and operational efficiency.
What is Monitor Fabric Activity?
“Monitor Fabric activity” refers to the collection, analysis, and visualization of performance data across interconnected systems, applications, and devices within a network. Think of it as the nervous system of your IT infrastructure, constantly sending signals about how well different components are functioning together.
From monitoring network traffic and system loads to error rates and anomalies, it provides a holistic view of your environment, helping administrators stay one step ahead.
Key Features of Monitor Fabric Activity
In Microsoft Fabric, activities and jobs are scheduled to perform critical tasks such as data movement, transformation, and delivery. Since these activities often depend on one another, ensuring that data arrives in the right place, at the right time, is crucial. Delays or errors in one step can cascade across the system, affecting users and downstream processes.
That’s why end-to-end monitoring is essential—not only to maintain reliability and performance but also to quickly identify long-running operations, resolve errors, and minimize downtime. By effectively monitoring Fabric activities, organizations can keep their data pipelines resilient and ensure business continuity.
Below are the core activities in Fabric that should always be monitored.
1. Data Pipeline Activity
A data pipeline is a collection of activities that together execute data ingestion and transformation tasks. Instead of managing tasks individually, pipelines let you orchestrate ETL (Extract, Transform, Load) processes in one place.
Monitoring focus areas:
- Track success or failure of pipeline runs.
- Investigate errors when a pipeline fails.
- Review job history to compare performance trends over time.
- Identify when issues first appeared in a process to speed up troubleshooting.
2. Dataflows
Dataflows provide a low-code way to ingest, load, and transform data. They can be run manually, scheduled, or integrated into pipelines.
Monitoring focus areas:
- Keep an eye on start and end times, status, and duration of runs.
- Monitor table load activities to ensure data lands correctly.
- Drill into error details to identify root causes and fix problems efficiently.
3. Semantic Model Refreshes
A semantic model is a ready-to-use representation of your data for reporting and visualization, complete with transformations, calculations, and relationships. Any updates to the underlying data require the model to be refreshed.
Monitoring focus areas:
- Track refresh activity triggered by pipelines.
- Watch for refresh retries—these may indicate transient issues.
- Distinguish between temporary glitches and persistent failures.
4. Spark Jobs, Notebooks, and Lakehouses
Fabric integrates with Apache Spark via notebooks, enabling scalable data processing and transformations for lakehouses.
Monitoring focus areas:
- Track Spark job progress and task execution.
- Monitor resource usage to ensure efficient scaling.
- Review Spark logs to identify performance bottlenecks or errors.
5. Microsoft Fabric Eventstreams
Eventstreams handle continuous ingestion of real-time or streaming data, such as sensor readings or application events. These streams run perpetually, feeding analytics systems and routing data to multiple destinations.
Monitoring focus areas:
Monitor data quality and throughput to maintain real-time analytics reliability.
Track ingestion status to confirm data is flowing.
Measure event ingestion performance to detect slowdowns.
Why Monitoring Fabric Activity Matters
Improved Performance
Continuous monitoring enables teams to fine-tune resources, optimize applications, and minimize downtime—delivering a smoother experience for end-users.
Enhanced Security
By analyzing traffic patterns and detecting anomalies, monitoring fabric activity can serve as an early warning system against security threats or suspicious behavior.
Data-Driven Decisions
Armed with accurate insights, organizations can make informed decisions around resource allocation, infrastructure upgrades, and process improvements, ensuring long-term efficiency and growth.
Getting Started with Monitor Fabric Activity
- Set Up a Monitoring Hub – Deploy a monitoring hub that supports fabric activity tracking.
- Define Key Metrics—Identify the performance indicators most critical to your business goals.
- Configure Dashboards & Alerts—Build dashboards to visualize core metrics and set alerts for anomalies.
- Analyze Regularly—Schedule routine reviews to uncover patterns and trends.
- Drive Continuous Improvement—Use insights to refine IT processes and future-proof your infrastructure.
Take action with Microsoft Fabric Activator
When monitoring surfaces changing data, anomalies, or critical events, it’s not enough to just observe what’s happening—you also need to act immediately. This is where alerts and automated actions come into play. By integrating monitoring with real-time triggers, organizations can ensure that important events are never missed, and responses are both timely and automated.
Real-Time Data Streams
Most real-time analytics is built around the ingestion and processing of a perpetual data stream—a continuous flow of events that represent specific point-in-time occurrences. Examples include:
- Environmental data from IoT weather sensors.
- Transaction logs from an e-commerce platform.
- Telemetry from connected vehicles or industrial equipment.
- Social media feeds or clickstream data from websites.
These data streams need to be processed continuously so that insights and actions are delivered as events happen, not hours later.
The Role of Activator in Fabric
Within Real-Time Intelligence in Microsoft Fabric, the Activator tool serves as the automation engine for streaming data. It allows you to define rules and logic that automatically trigger actions based on the data flowing through your event streams.
For example:
- A weather sensor stream could trigger an email alert to sailors when wind speeds exceed a defined threshold.
- A stream of IoT data from factory machines might trigger a Fabric pipeline when equipment temperatures surpass safe levels.
- Financial transaction streams could initiate a Power Automate workflow if unusual patterns suggest potential fraud.
Types of Logic That Trigger Actions
The Activator isn’t limited to simple thresholds—it supports a wide range of logic for triggering responses:
- Threshold-Based Logic
- Example: Send an alert when CPU usage exceeds 90% for more than 5 minutes.
- Pattern Recognition
- Example: Detect if a login failure occurs more than three times within 10 minutes, which could signal a brute-force attack.
- Kusto Query Language (KQL) Logic
- Example: Use KQL queries to identify complex conditions across data streams, such as detecting anomalies in energy consumption compared to historical averages.
By combining these logic types, organizations can move from reactive monitoring to proactive, automated responses.
Benefits of Real-Time Alerts in Fabric
Better User Experience: Critical events (such as delayed payments, high sensor readings, or stockouts) can be addressed before they impact end-users.
Reduced Downtime: Immediate detection and response minimize the impact of system or process failures.
Improved Security: Unusual patterns or suspicious events can be flagged instantly, strengthening your security posture.
Operational Efficiency: Automating responses (like kicking off a pipeline or workflow) eliminates manual intervention and accelerates time-to-action.
Case Study:
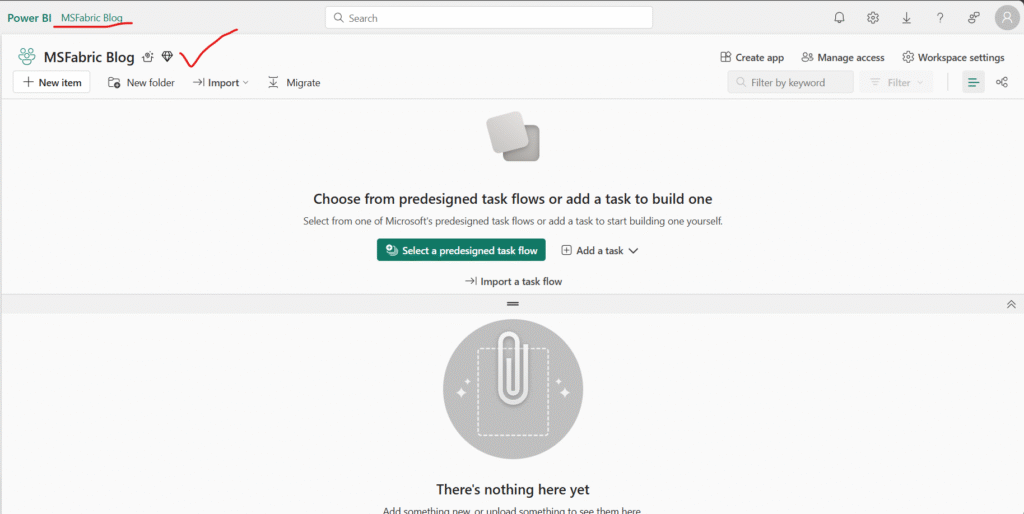
Before working with data in Fabric, create a workspace name : MSFabric Blog in a tenant with the Fabric capacity enabled.
I have selected a licensing mode in the Advanced section that includes Fabric capacity (Trial).
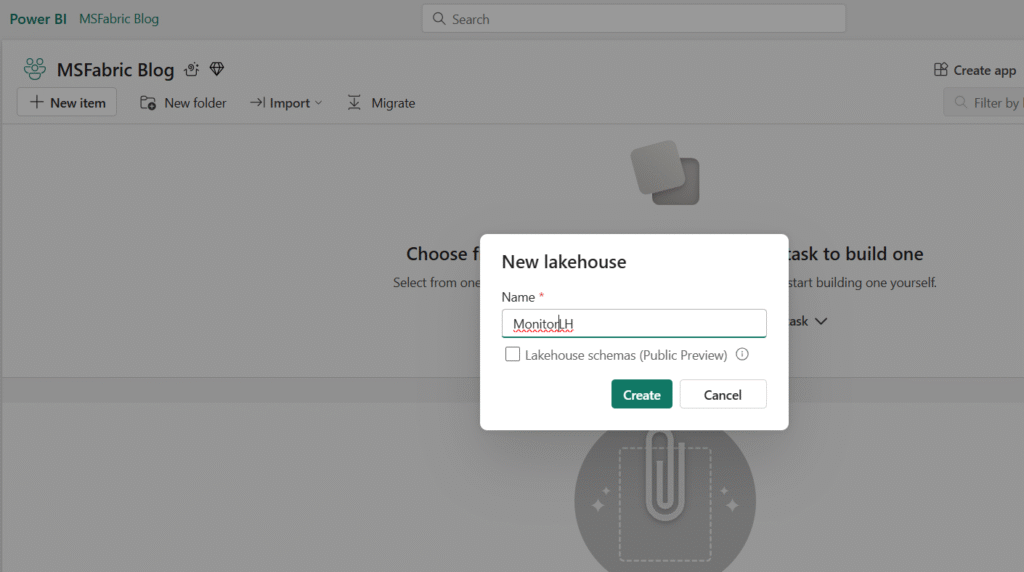
Create a Lakehouse
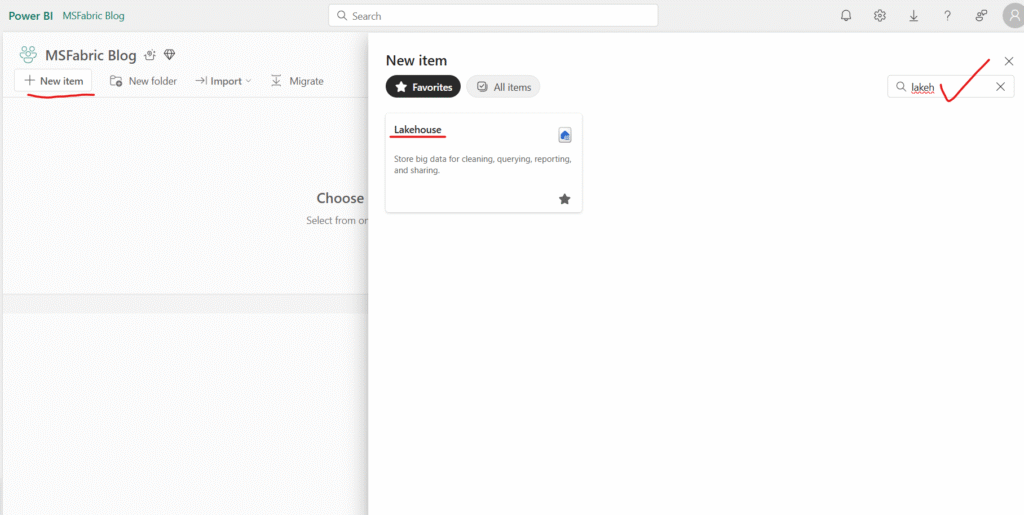
given an lakehouse name:
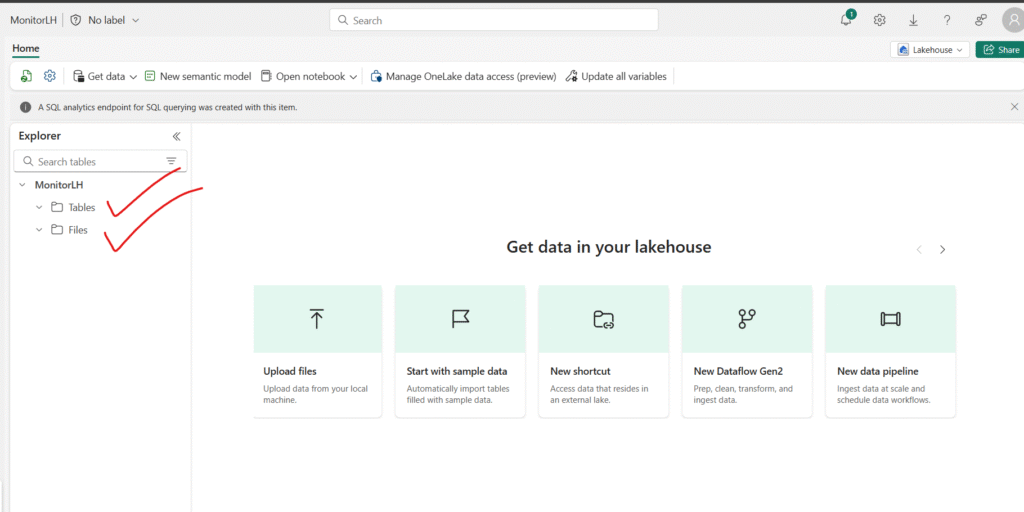
Once lakehouse created, View the new lakehouse, and note that the Lakehouse explorer pane on the left enables you to browse tables and files in the lakehouse with folder representation:
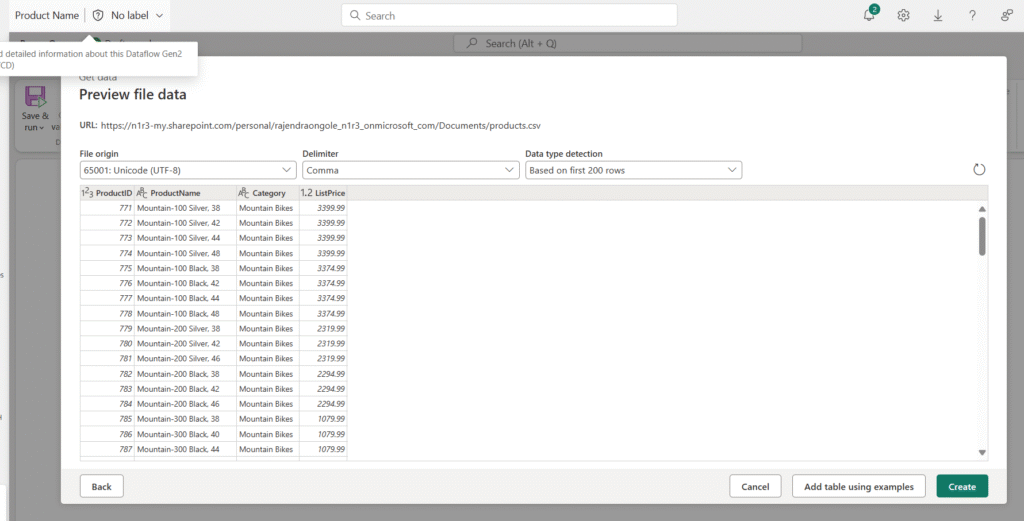
On the Lakehouse Home page, open the Get data menu and select New Dataflow Gen2.
Enter Get Product Data as the name for the new dataflow, then select Create.
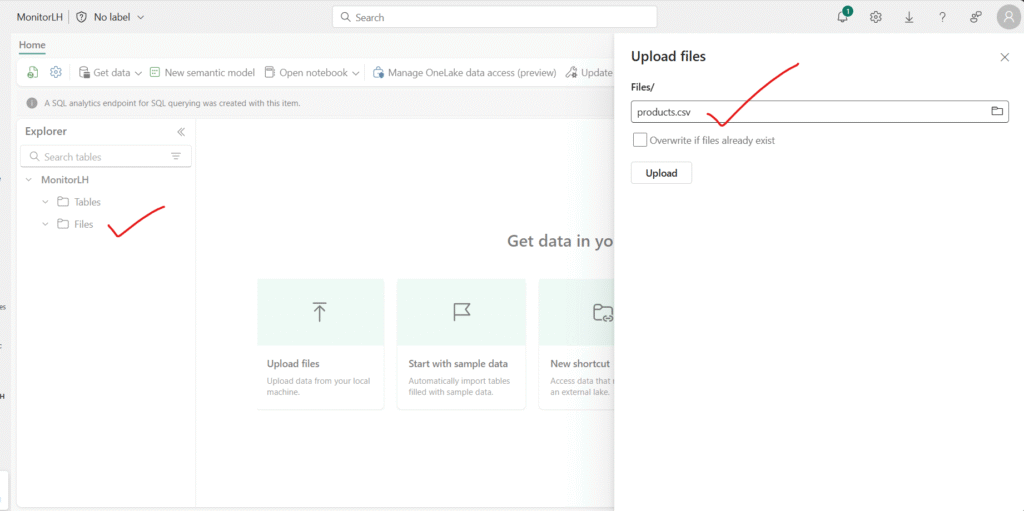
Datasets/products.csv at main · rajendra1918/Datasets
Right click on the file,
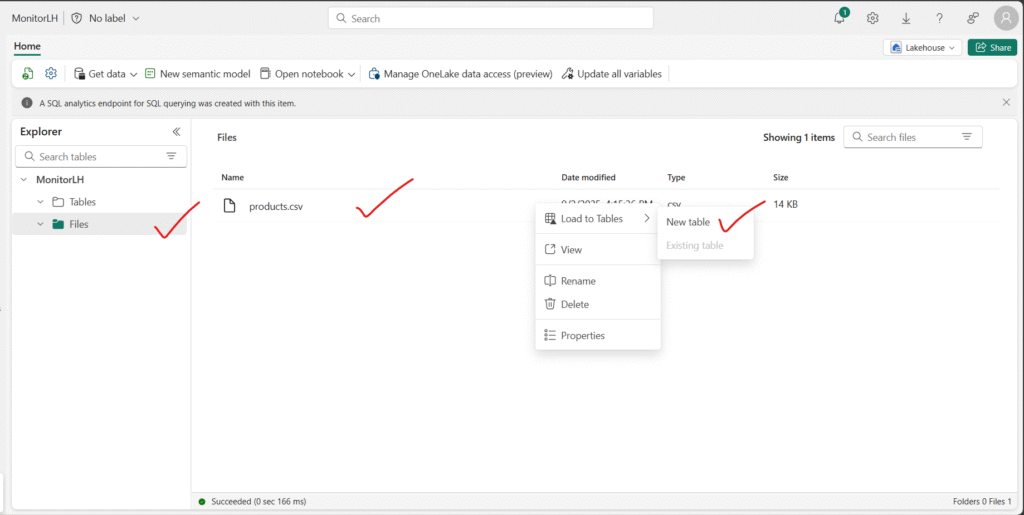
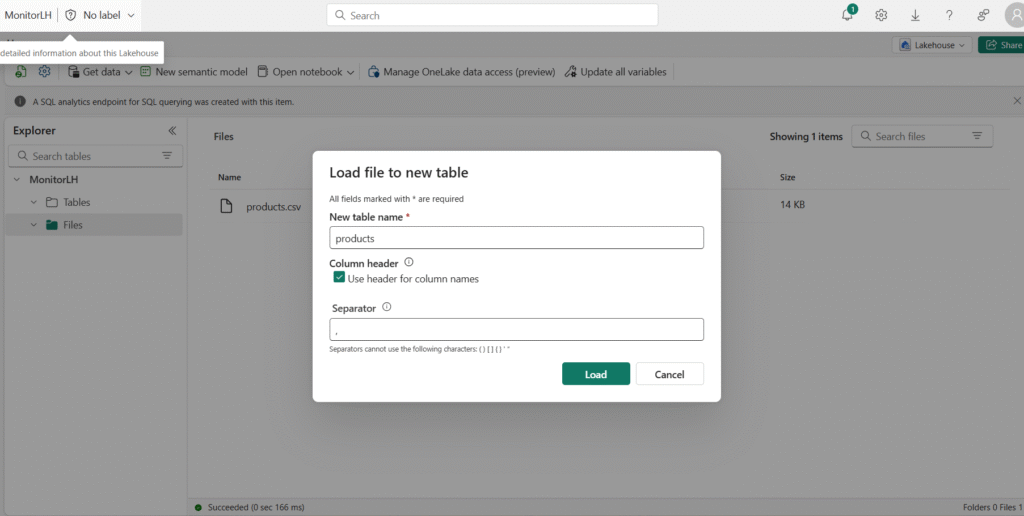
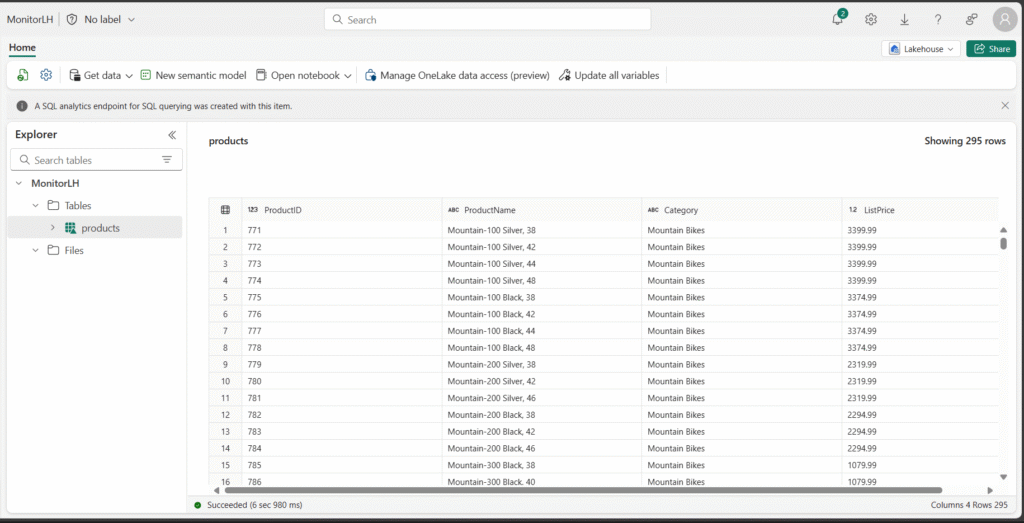
Once the table move to Table folder, inside the product you can select it to see the data as like below:
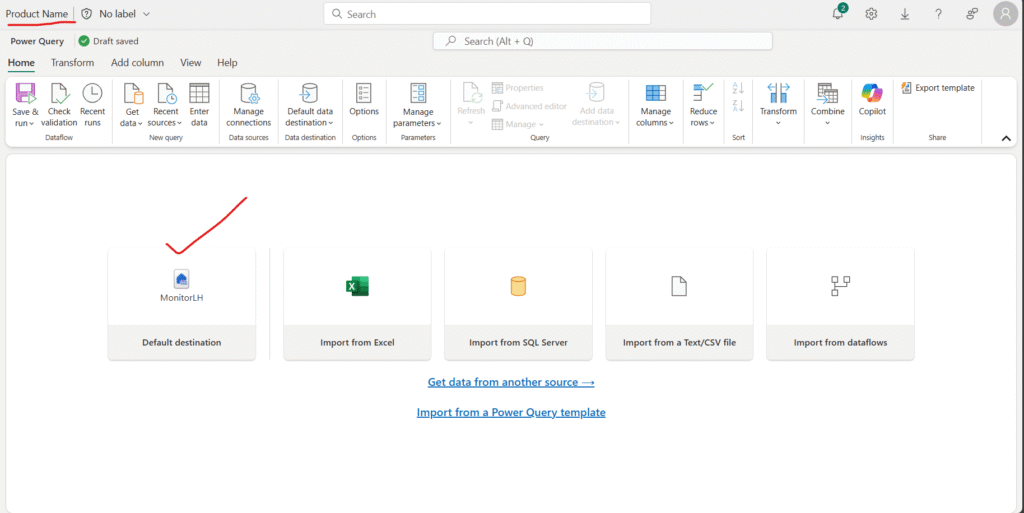
or via Dataflow below is the process. given the name as ProductName, you can also observe the new feature, the Default destination highlighted
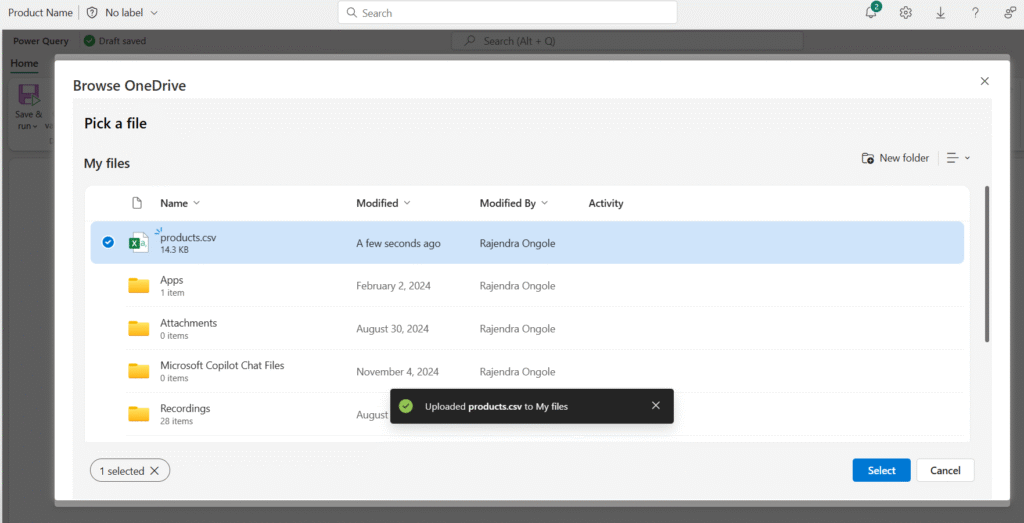
extracted the csv file:
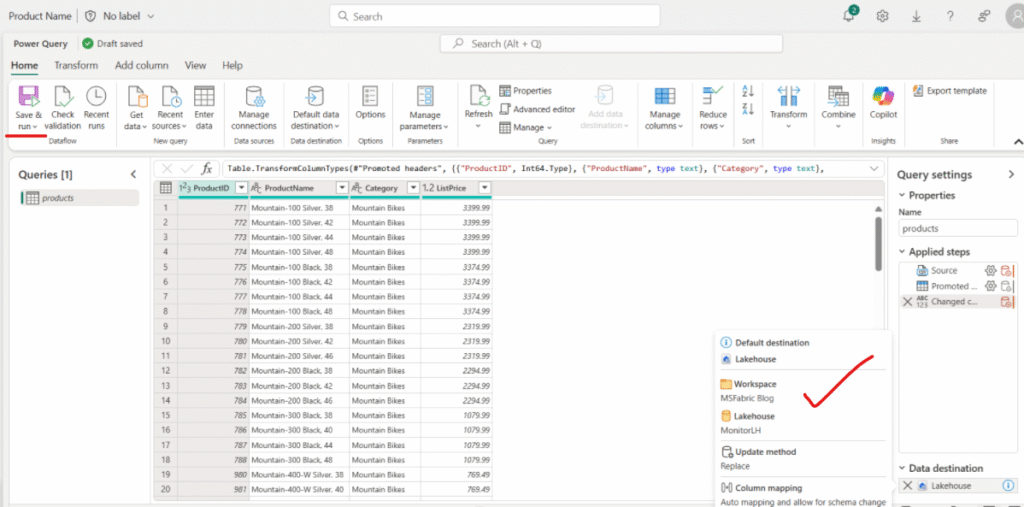
you can use save and run at highlighted right side of the dataflow.
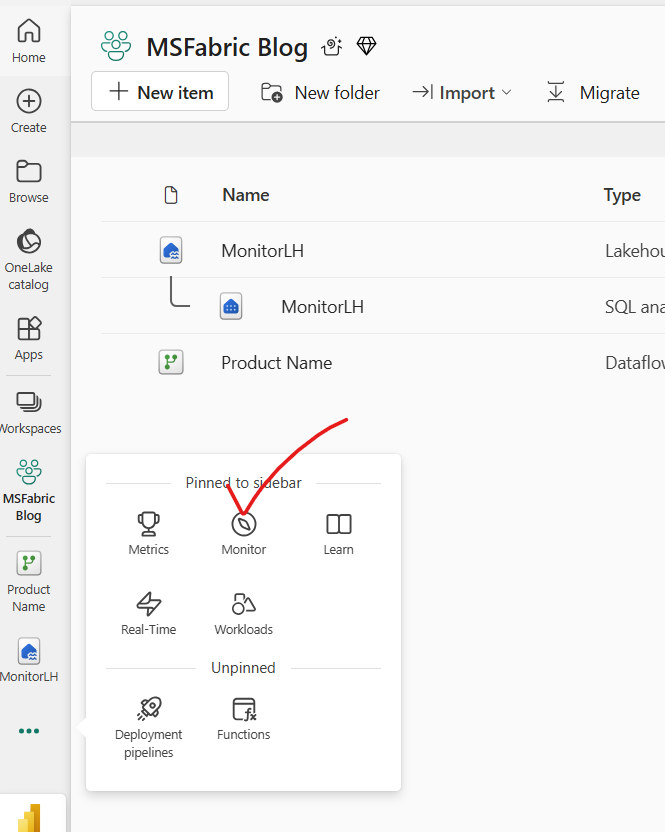
In the left navigation bar, select Monitor to open the monitoring hub. Verify that your dataflow is in progress. If it is not visible, refresh the view until it appears.
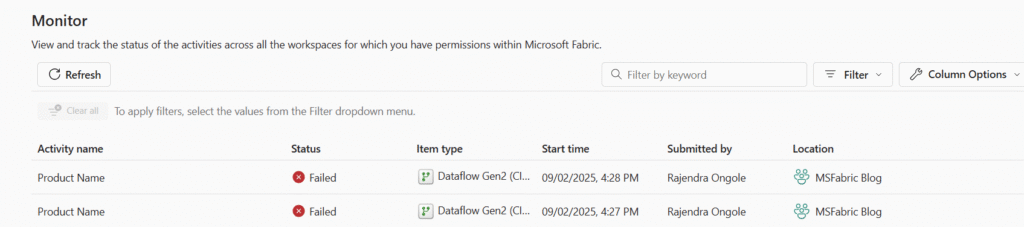
- Wait for a few seconds, and then refresh the page until the status of the dataflow is Succeeded.
- In the navigation pane, select your lakehouse. Then expand the Tables folder to verify that a table named products has been created and loaded by the dataflow (you may need to refresh the Tables folder).
Schedule Options:
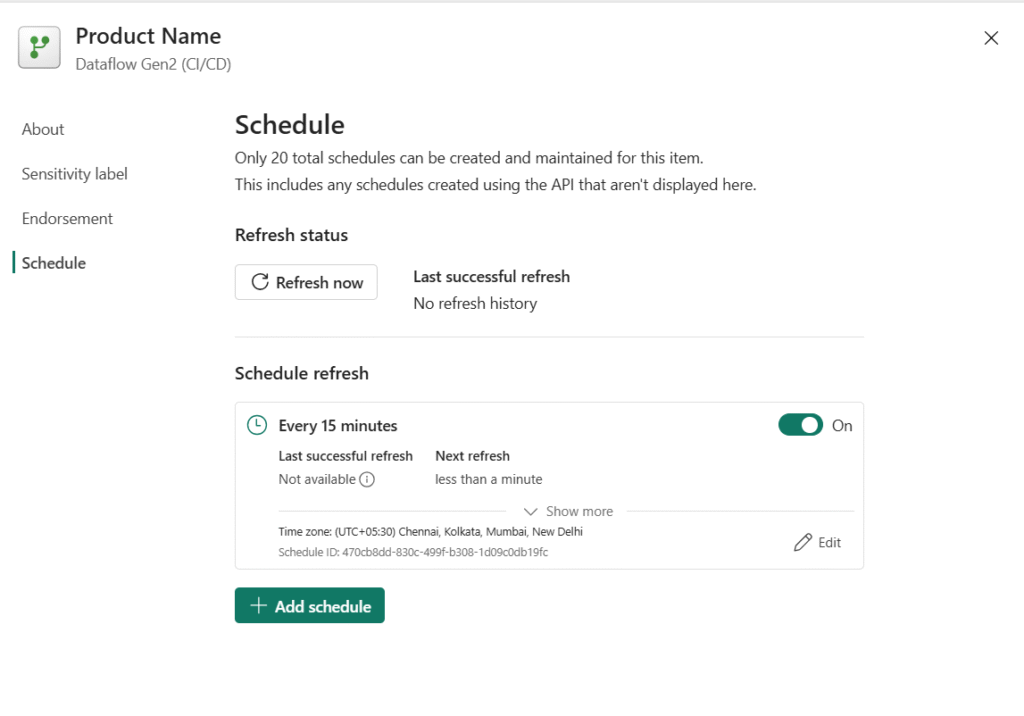
Inprogress status:
On the menu bar on the left, select Create. In the New page, under the Data Engineering section, select Notebook.A new notebook named Notebook 1 is created and opened.
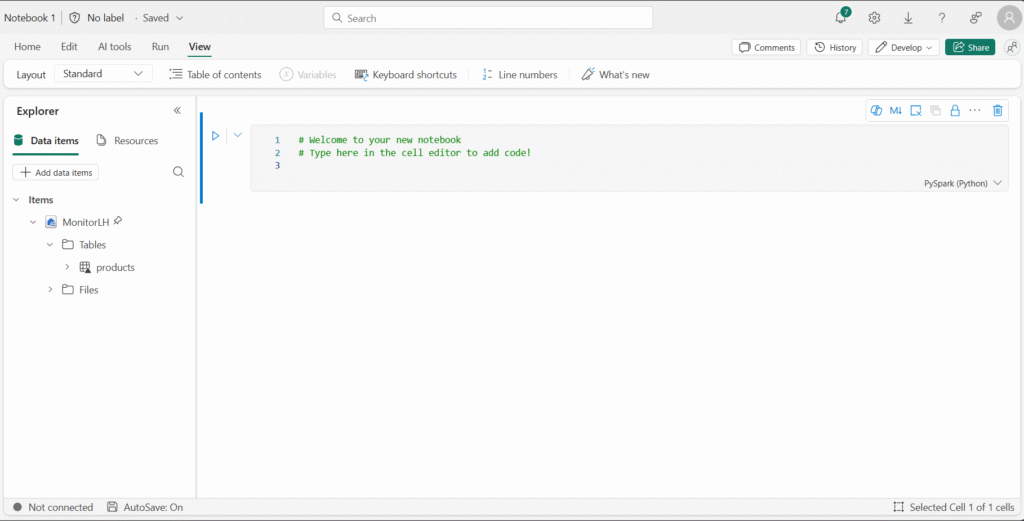
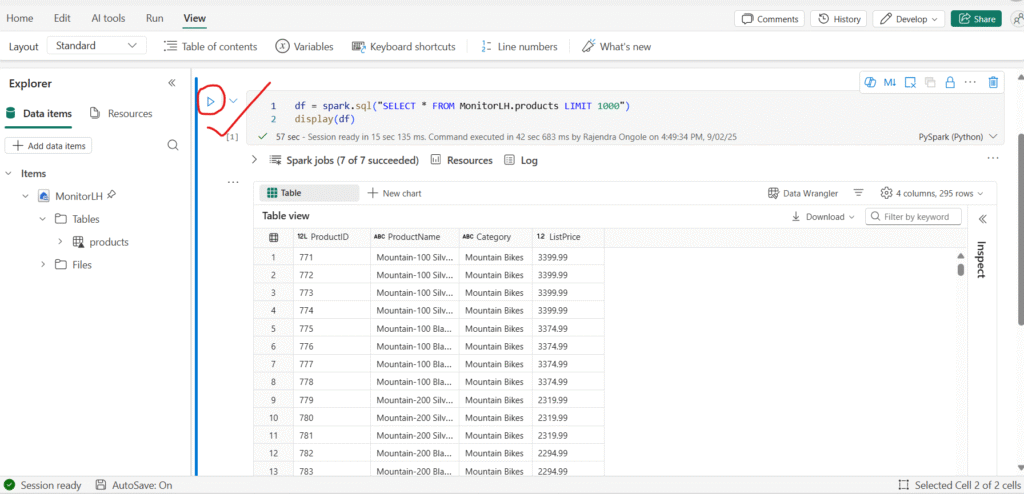
Use the ▷ button to run cell in the notebook. It will take a moment or so to start the Spark session, and then the results of the query will be shown under the code cell.
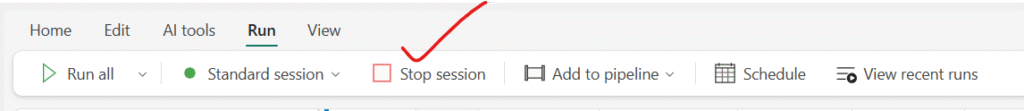
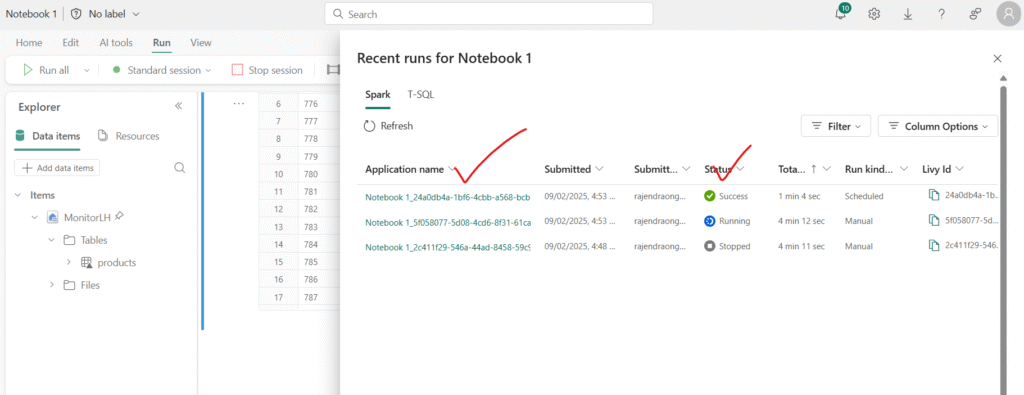
On the toolbar, select the ◻ (Stop session) button to end the Spark session. Then, in the left navigation bar, select Monitor to open the monitoring hub and confirm that the notebook activity is listed.
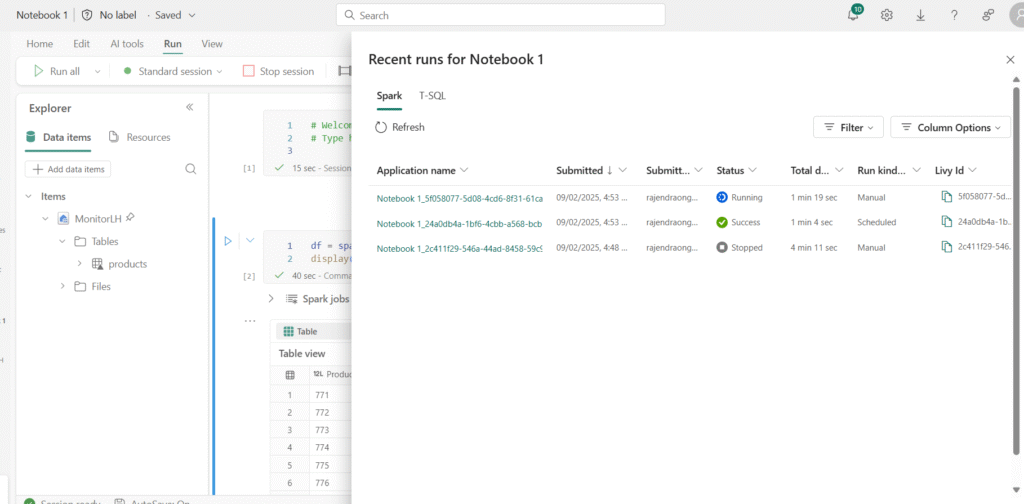
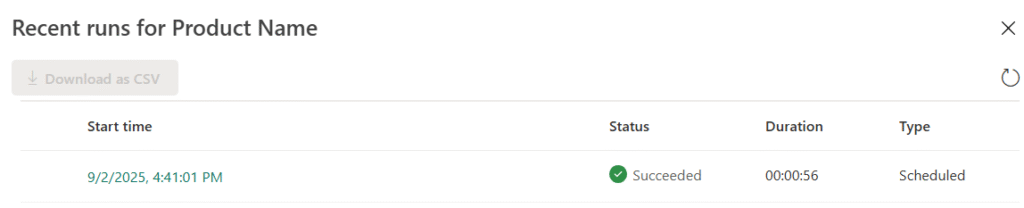
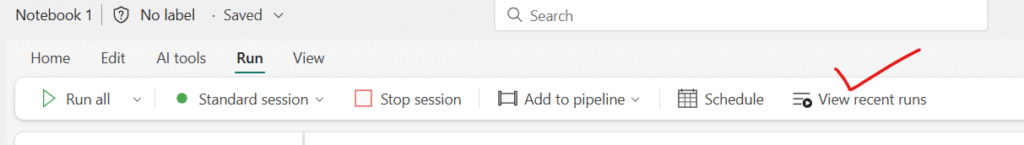
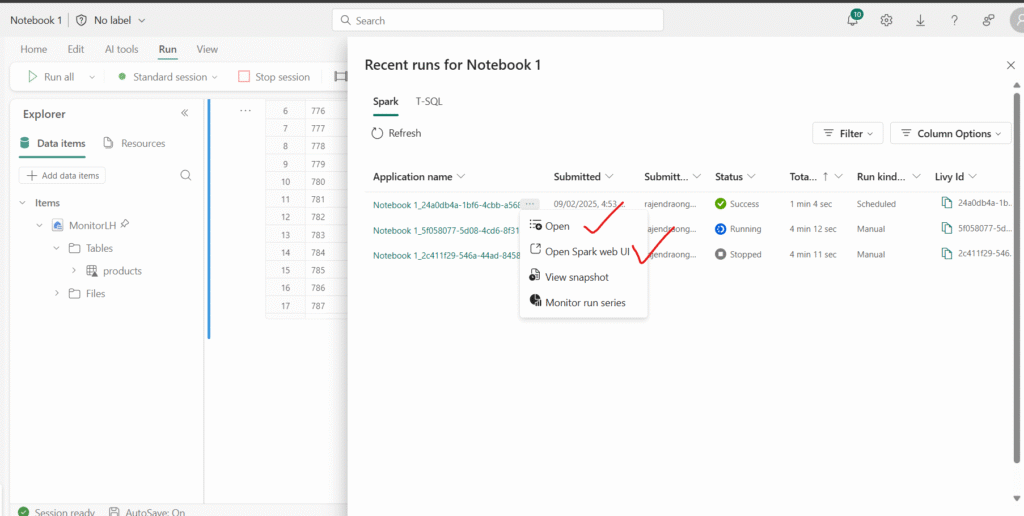
use the View recent runs option to check the status of the scheduled jobs:
More additional details of the notebook run series:
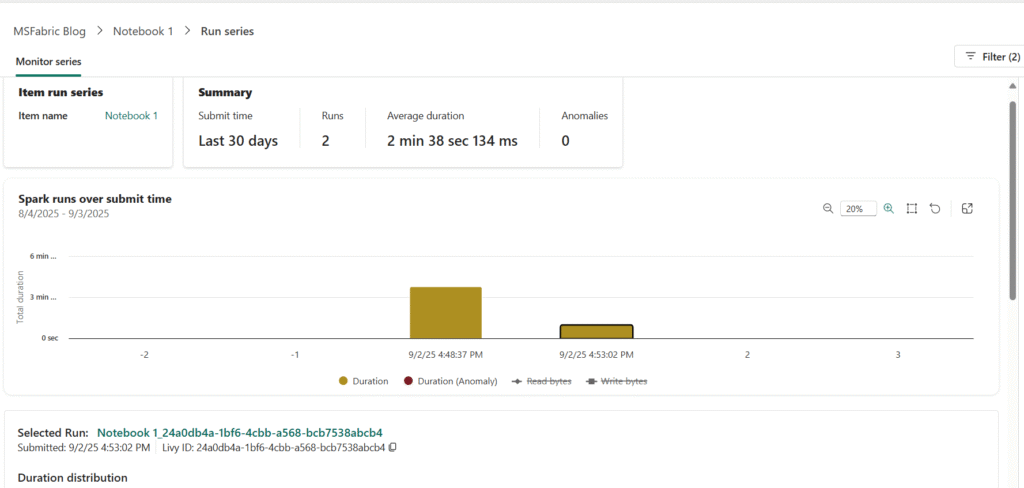
Monitor history for an item: Some items in a workspace may run multiple times. You can use the monitoring hub to view their run history.
- In the navigation bar, return to your workspace page.
- Use the ↻ (Refresh now) button for the Get Product Data dataflow to re-run it.
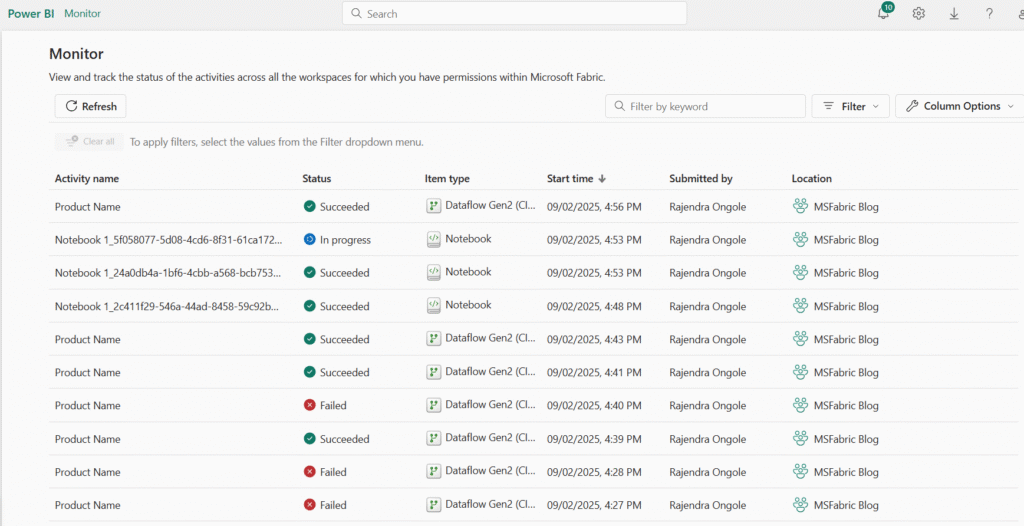
- In the navigation bar, select Monitor to open the monitoring hub and confirm that the dataflow is in progress.
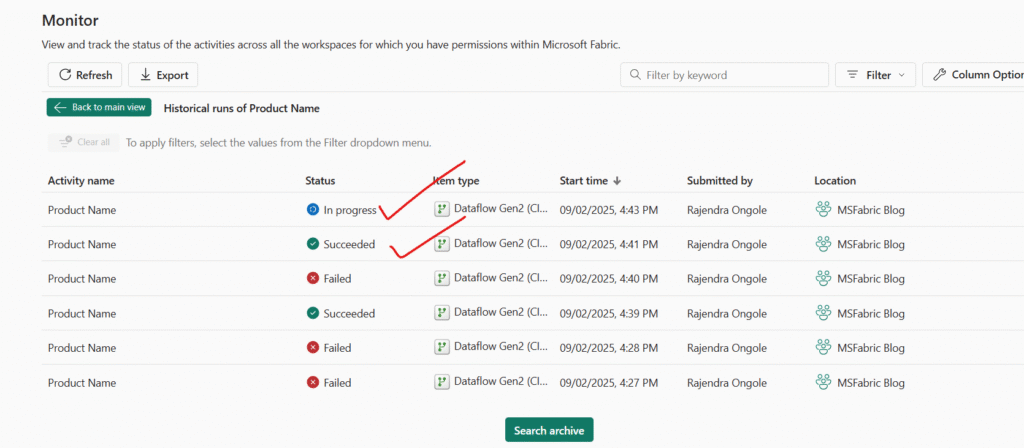
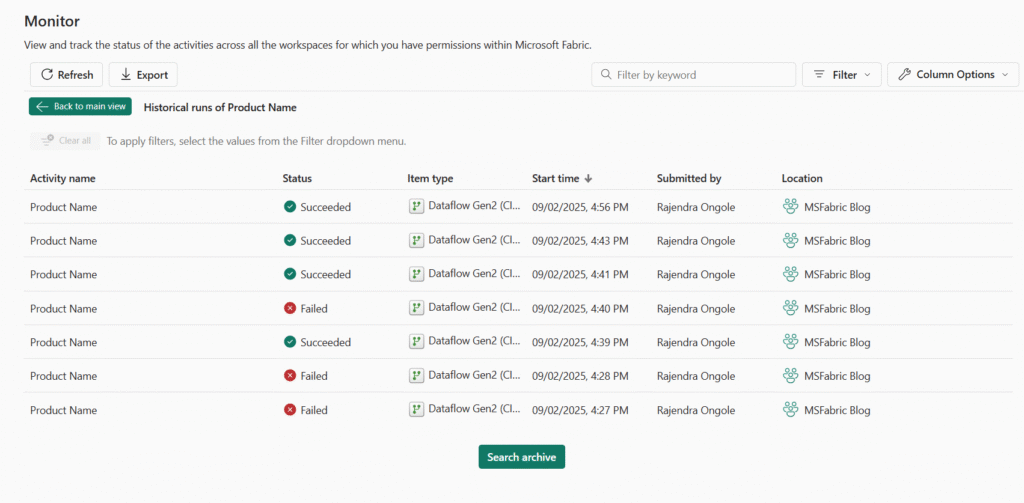
- From the … activity name example Below one Product Name for the Get Product Data dataflow, select Historical runs to view its run history.
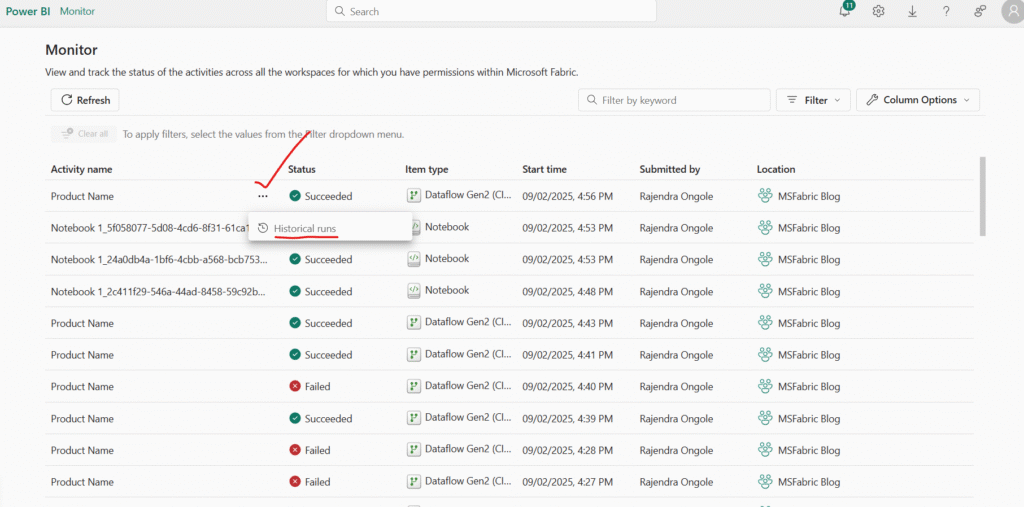
Historical Runs:
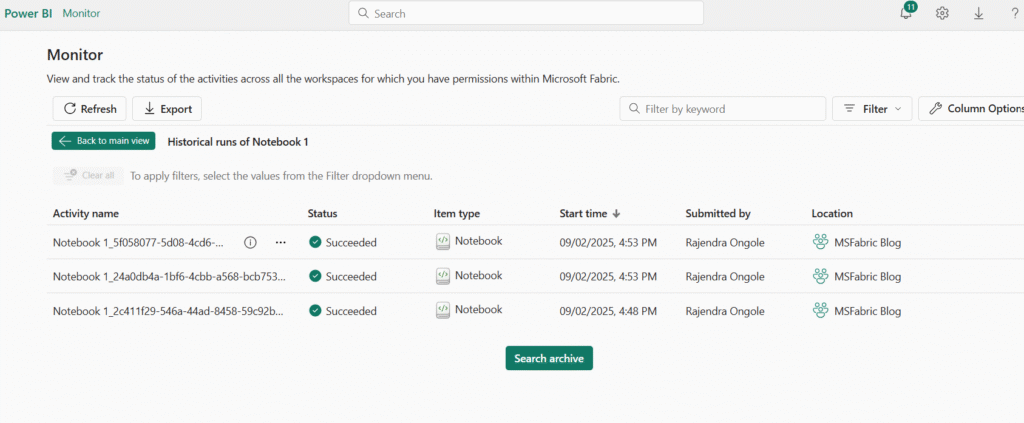
Notebook Historical Runs
Customize monitoring hub views
You’ve only run a few activities, so finding events in the monitoring hub should be straightforward. In a real environment, however, you may need to search through a much larger number of events. Applying filters and customizing the view can help narrow down the results.
- In the monitoring hub, select the Filter button.
- Apply the following filters:
- Status: Succeeded
- Item type: Notebook
- With the filters applied, only successful runs of Notebook items are displayed.
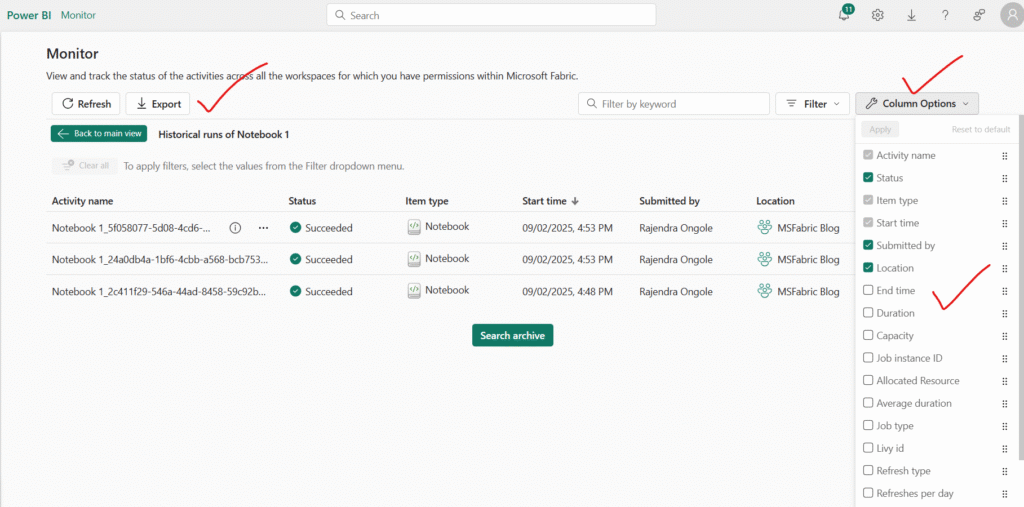
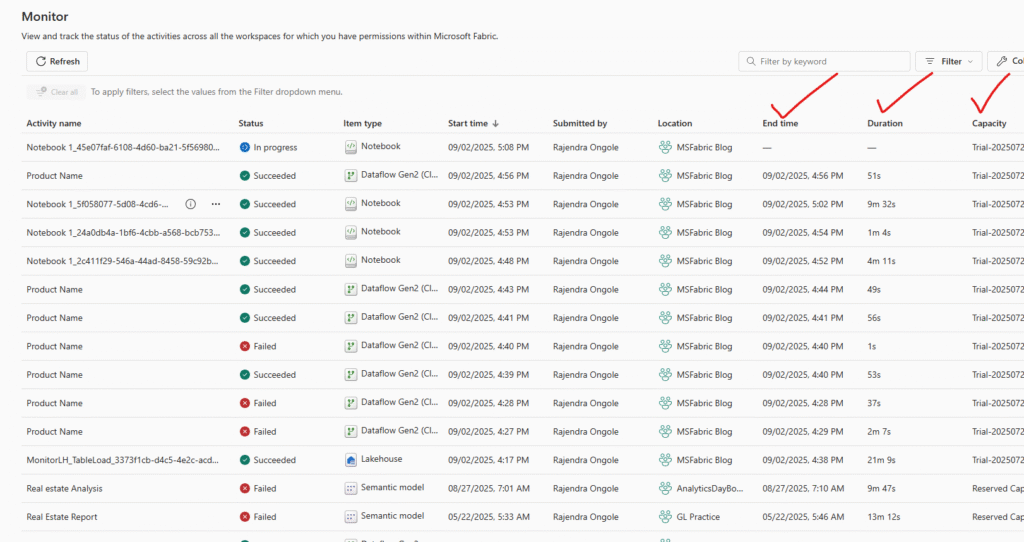
In the monitoring hub, select the Column options button. Then include the following columns in the view, and choose Apply to save the changes:
- Activity name
- Status
- Item type
- Start time
- Submitted by
- Location
- End time
- Duration
- Refresh type
Conclusion
In today’s data-driven landscape, monitoring is no longer optional—it’s essential. Monitor Fabric activity in the monitoring hub provides organizations with the tools they need to achieve real-time visibility, detect issues early, and act with precision. From pipelines and dataflows to notebooks, Spark jobs, and event streams, every component can be tracked, optimized, and secured within a single, unified experience.
By applying filters, customizing views, and leveraging automation through tools like Activator, teams can move beyond reactive troubleshooting to proactive, intelligent operations. This shift not only reduces downtime and improves performance but also strengthens security and accelerates innovation.
Ultimately, adopting Monitor Fabric activity means investing in resilience. It ensures that as your organization scales, your infrastructure remains reliable, your data pipelines stay healthy, and your teams are empowered to make smarter, faster decisions.
Happy Reading!!