
In today’s data-driven world, organizations need instant insights to make fast, informed decisions. Microsoft Fabric makes this possible by allowing users to create comprehensive real-time dashboards that visualize data as it changes — all in one unified platform.
This step-by-step guide will walk you through setting up your own real-time dashboard in Microsoft Fabric — from connecting your data sources to enabling live updates.
Step 1: Getting Started with Microsoft Fabric
Sign Up or Log In
- Visit the Microsoft Fabric website.
- Sign up for a new account or log in using your Microsoft credentials.
Navigate to the Fabric Workspace
Once logged in, head to your Fabric workspace, where you’ll manage datasets, reports, and dashboards.
Create a Workspace in Microsoft Fabric
Before you begin working with data in Microsoft Fabric, you’ll need to create a workspace that has Fabric capacity enabled. A workspace is where you’ll organize your datasets, dataflows, and dashboards.
Steps to Create a Workspace
Go to the Fabric Home Page
Open your browser and navigate to https://app.fabric.microsoft.com/home?experience=fabric
.
Sign in using your Microsoft Fabric credentials.
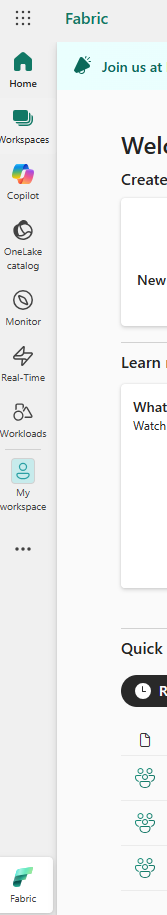
Access Workspaces
In the left-hand menu, select Workspaces (the icon resembles 🗇).
This section displays all your existing workspaces.
Create a New Workspace
Click + New Workspace and enter a name of your choice.
When prompted, select a licensing mode that includes Fabric capacity — such as Trial, Premium, or Fabric.
Confirm Workspace Creation
Once created, your new workspace will open. It should appear empty initially, ready for you to add data and build dashboards.
Create an Eventhouse in Microsoft Fabric
Now that your workspace is ready, you can begin creating the Fabric items needed for your real-time intelligence solution. Let’s start by setting up an Eventhouse — a central component that captures and manages streaming data in real time.
Steps to Create an Eventhouse
- Open the Create Menu
In the left-hand navigation bar, select Create.
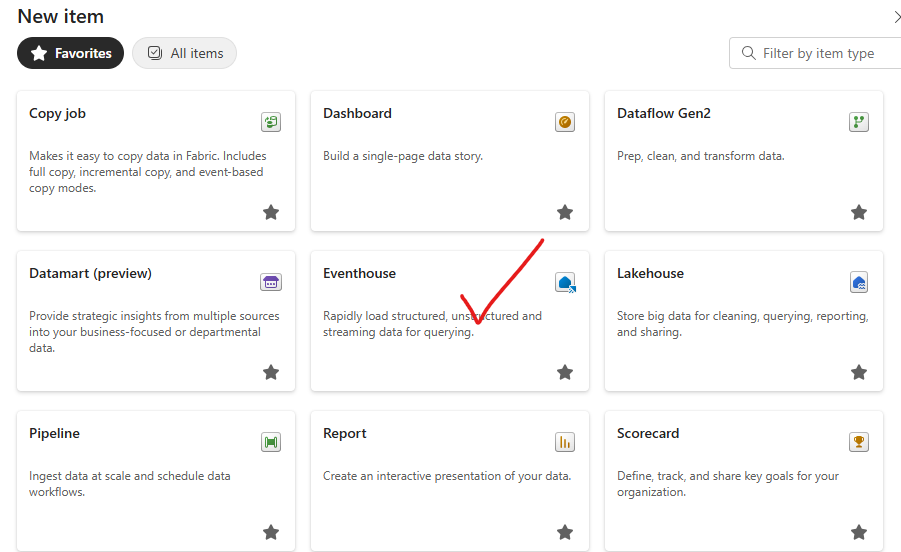
(If you don’t see the Create option pinned to the sidebar, click the ellipsis (…) to expand additional options.) - Select Eventhouse
On the New page, scroll to the Real-Time Intelligence section.
Choose Eventhouse from the available options. - Name Your Eventhouse
Enter a unique name for your Eventhouse — something that reflects its purpose or the data stream it will handle.
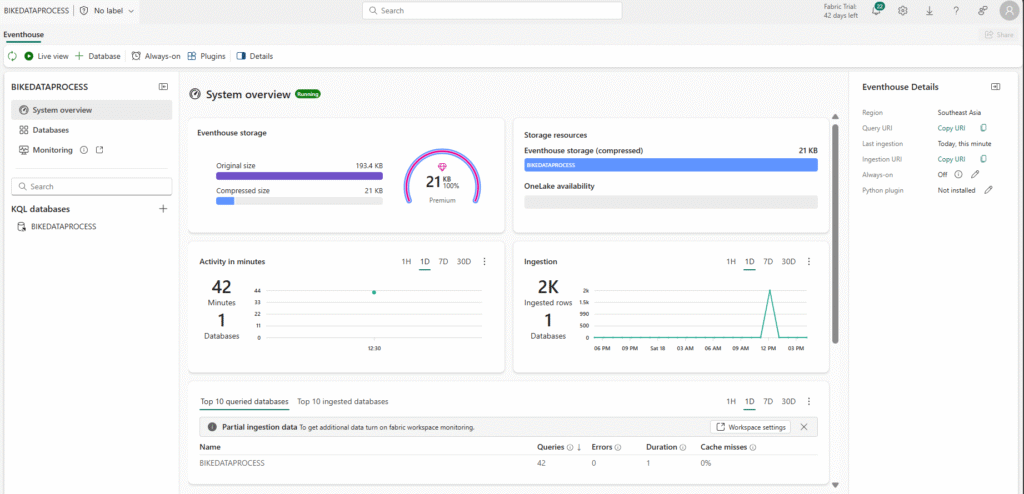
Once created, your Eventhouse will be ready to start receiving and processing real-time data streams.
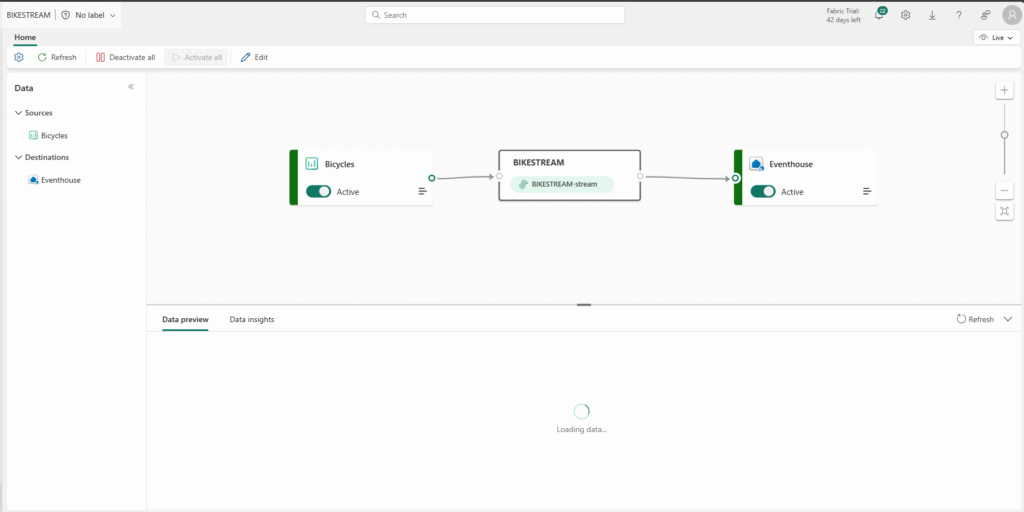
Now, Create an Eventstream in Microsoft Fabric
At this stage, your database doesn’t yet contain any tables. To bring in live data, you’ll create an eventstream — a pipeline that ingests and streams data from real-time sources directly into your tables.
Steps to Create an Eventstream
- Access the Data Import Option
In the main page of your KQL database, select Get Data. - Choose Eventstream as the Data Source
For the data source, select Eventstream and then choose New Eventstream. - Name Your Eventstream
When prompted, give your eventstream a meaningful name — for example, Bikestream.
Once created, your eventstream will be ready to connect to real-time data sources and begin streaming events into your database tables.
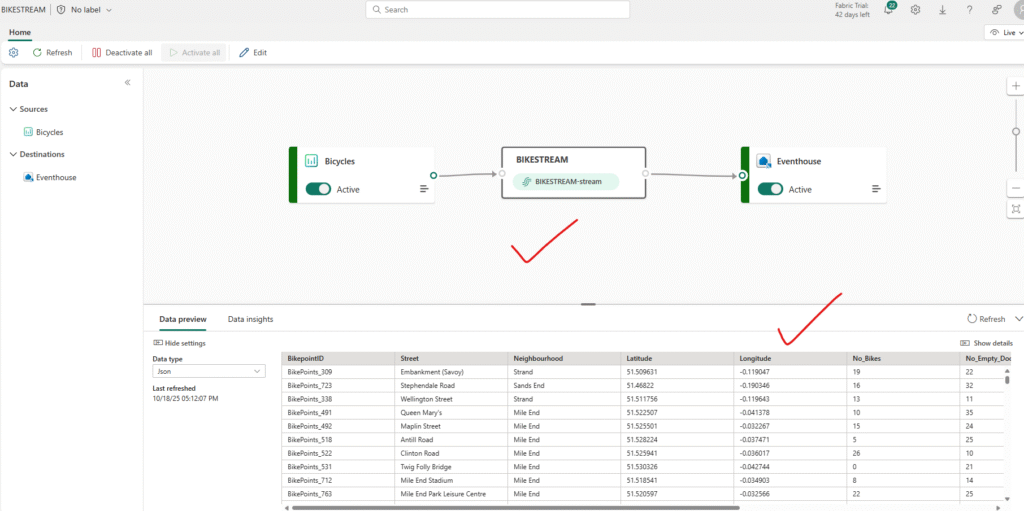
Steps to Configure the Destination
- Select the Destination Type
In the Add destination drop-down list, choose Eventhouse. - Configure Eventhouse Settings
In the Eventhouse configuration pane, set up the following options as required for your solution.
(For example: choose the target Eventhouse, select the destination database, and specify the output table name.)
Once configured, your eventstream will be ready to deliver real-time data directly into your Eventhouse tables.
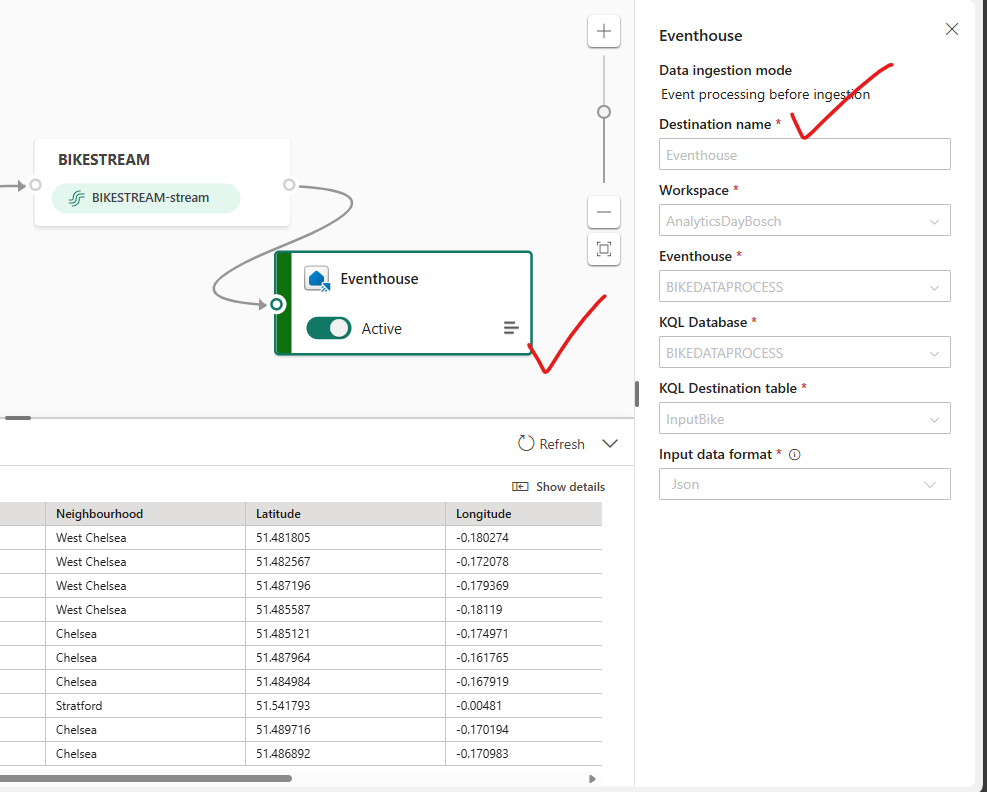
Eventhouse Settings
- Destination Name: Specify a unique identifier for your Eventhouse to organize streams and downstream analytics.
- Workspace: Select the appropriate workspace where your streaming setup will reside. Example: “AnalyticsDayBosch”.
- KQL Database and Table: Assign your KQL database (“BIKEDATAPROCESS”) and name the destination table (e.g., “InputBike”). The table receives processed events for real-time querying and dashboard visualization.
- Data Format: Choose the input data format (such as JSON) to ensure compatibility and schema enforcement.
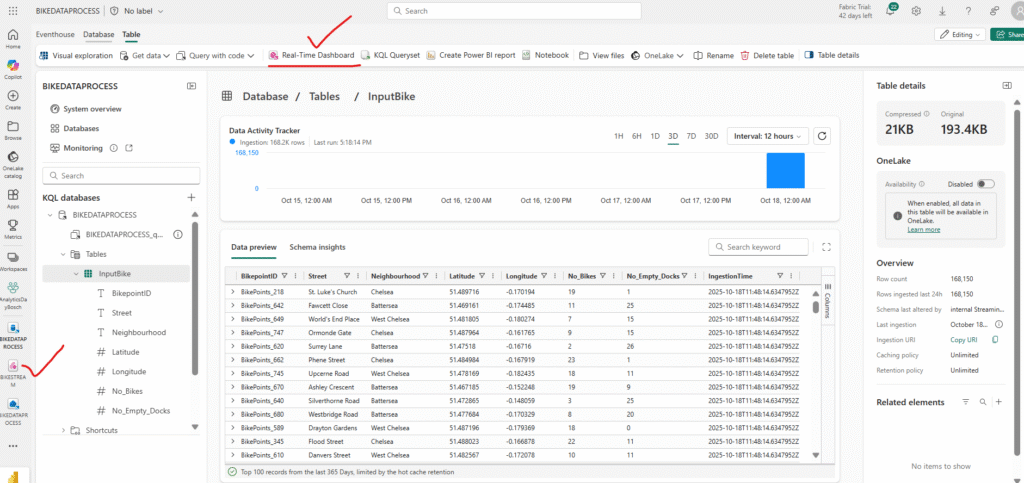
Create a Real-Time Dashboard in Microsoft Fabric
Now that your real-time data stream is flowing into a table within your Eventhouse, it’s time to bring that data to life through a real-time dashboard. This will allow you to monitor insights as they happen — instantly and interactively.
Steps to Create a Real-Time Dashboard
- Open the Create Menu
In the left-hand navigation bar, select Create.
(If you don’t see the Create option pinned to the sidebar, click the ellipsis (…) to reveal additional options.) - Select Real-Time Dashboard
On the New page, under the Real-Time Intelligence section, choose Real-Time Dashboard. - Name Your Dashboard
Enter a name for your dashboard — for example, bikes-dashboard — and confirm your selection.
Connect Your Dashboard to the Eventhouse Data
Display name: Bike Dashboard
- Database: The default database in your Eventhouse Bikestream
- Passthrough identity: Selected
- Save the Connection
Click Add to create the data source and link it to your dashboard.
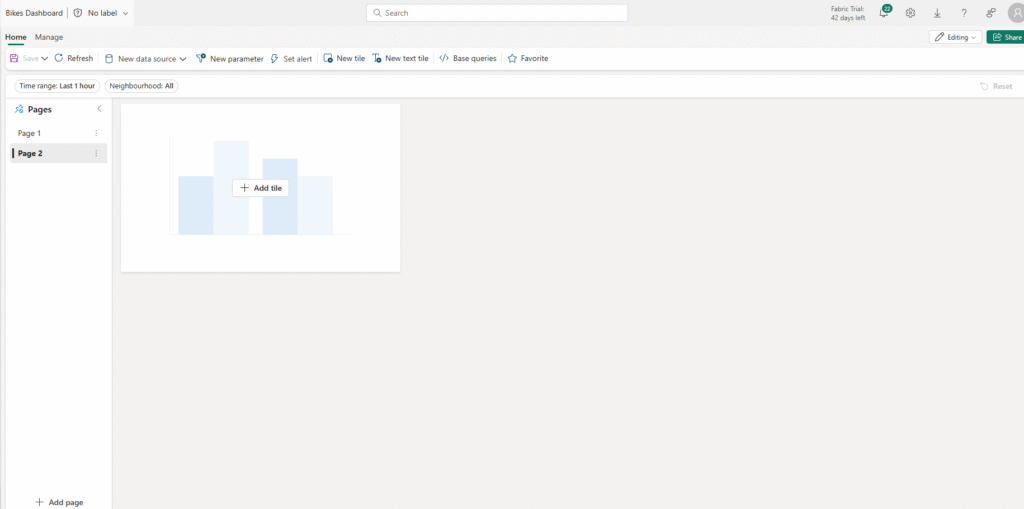
Add a Visual Tile
Once the connection is established, go to the dashboard design canvas and select Add tile to begin visualizing your live data.
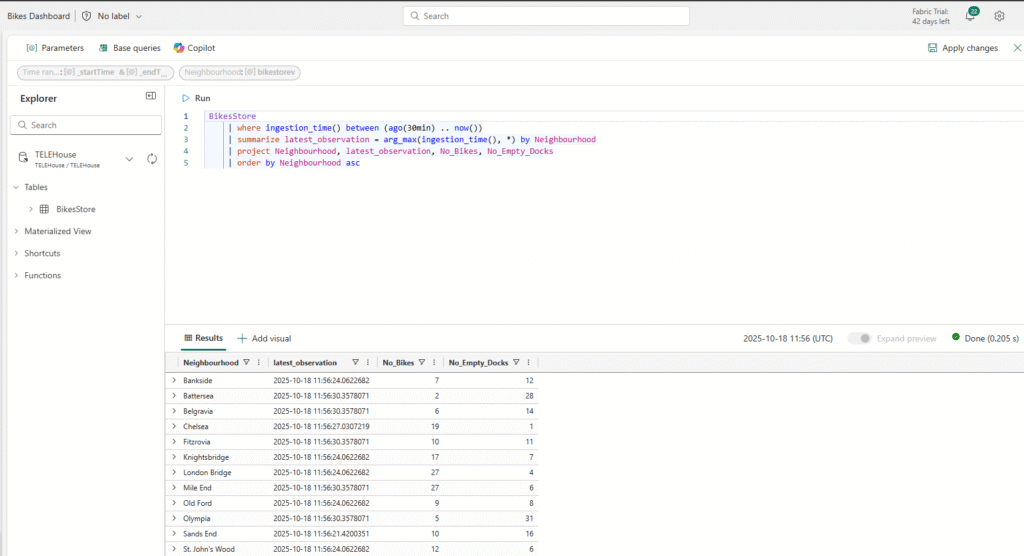
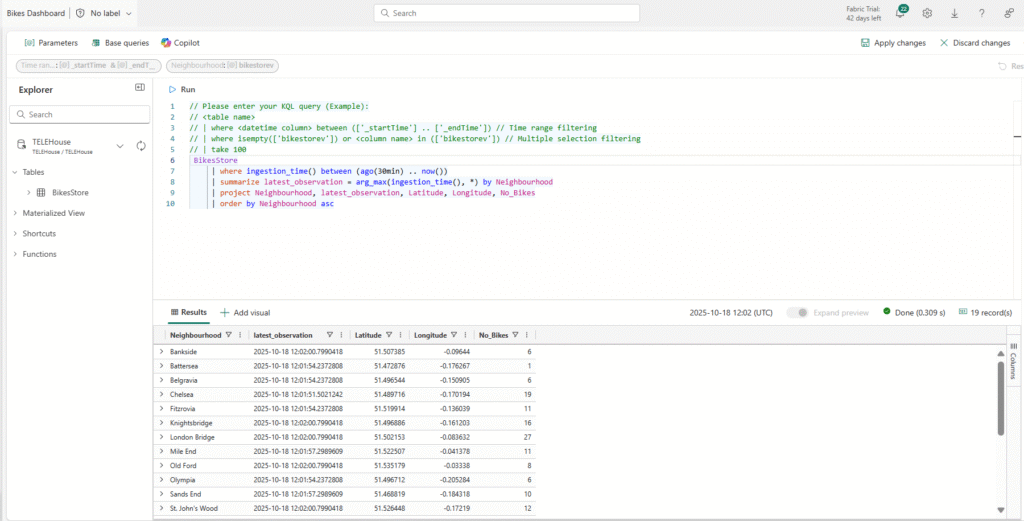
Now it’s time to bring your dashboard to life by running a query that displays real-time insights.
- Run the Query
Execute a query that retrieves the number of bikes and empty bike docks recorded in each neighborhood over the last 30 minutes. - Apply the Changes
After running the query, click Apply changes to update your dashboard.
You’ll now see the query results displayed in a table within the dashboard tile — giving you a live, continuously updated view of bike availability across neighborhoods.
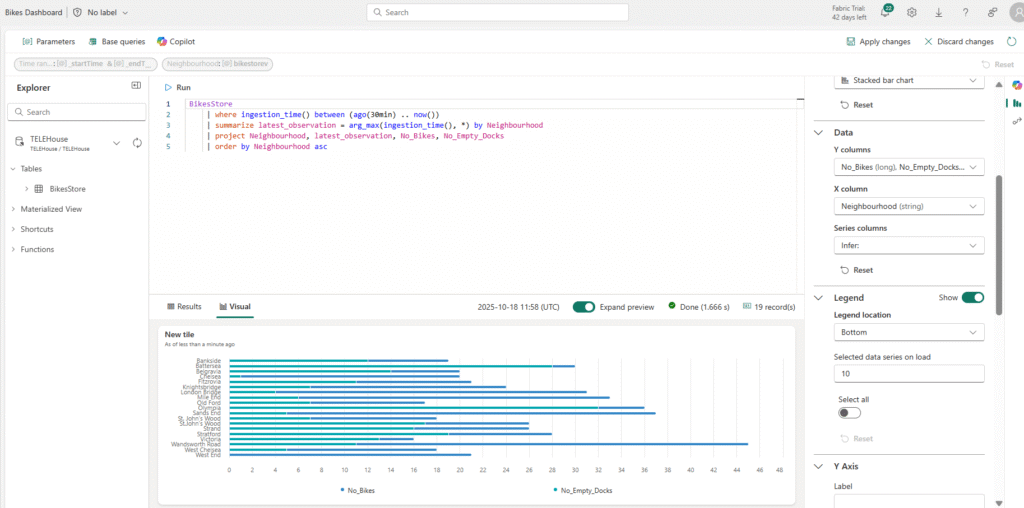
Open the Tile for Editing
On the tile, click the Edit icon (shaped like a pencil) to open the Visual Formatting pane.
Configure Visual Settings
Set the following properties:
- Tile name: Bikes and Docks
- Visual type: Bar chart
- Visual format: Stacked bar chart
- Y columns: No_Bikes, No_Empty_Docks
- X column: Neighbourhood
- Series columns: Infer
- Legend location: Bottom
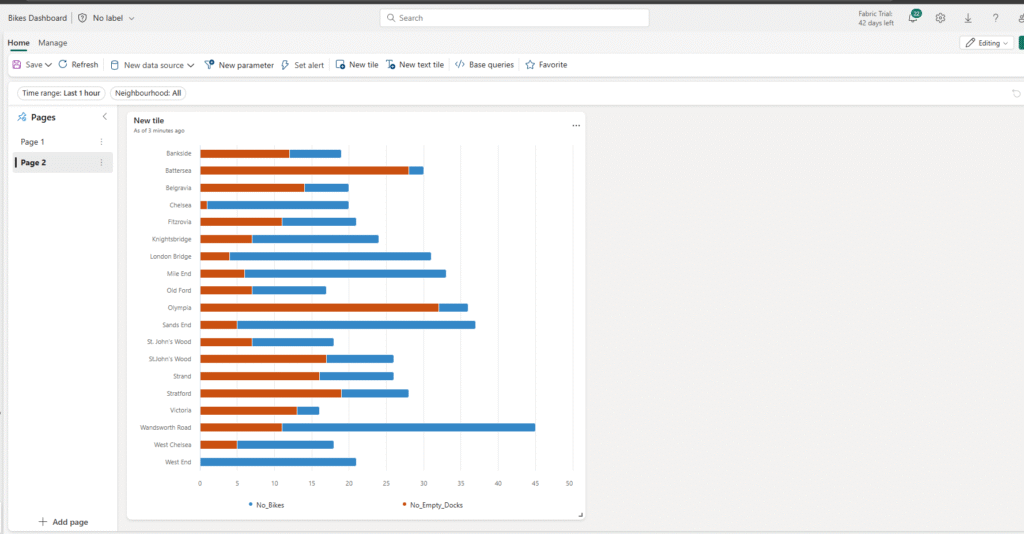
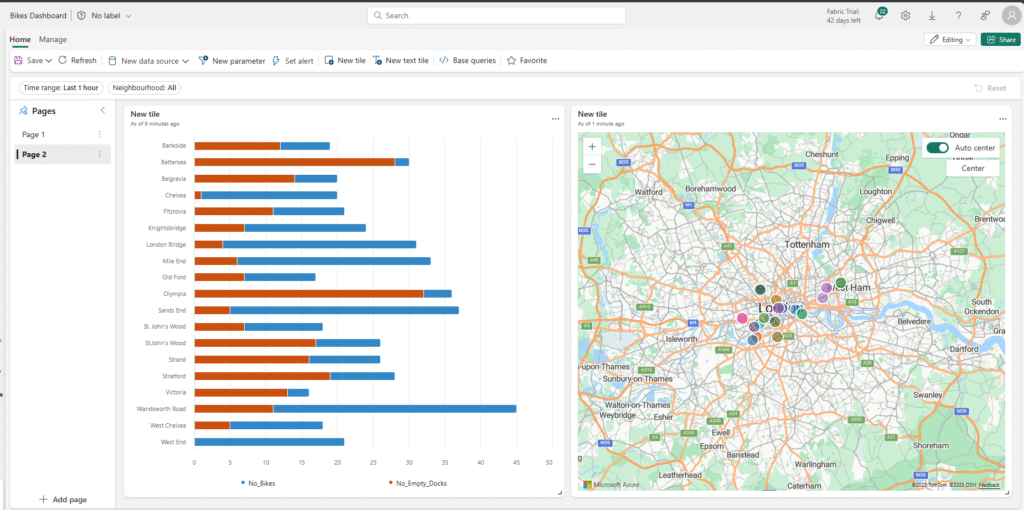
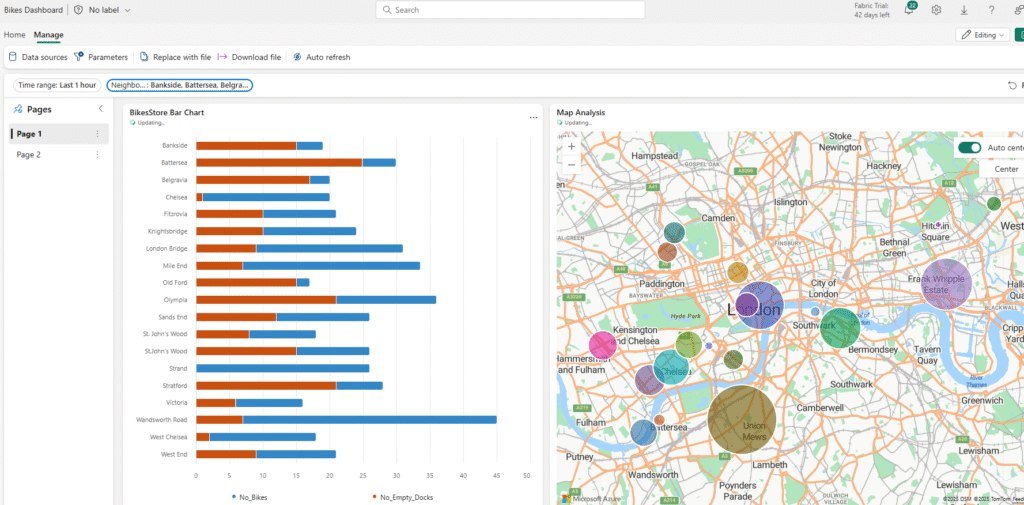
Review Your Tile
After applying these settings, your tile should display a stacked bar chart showing the number of bikes and empty docks per neighborhood, with the legend positioned at the bottom.
In the Query Editor, make sure your Bikestore source is selected. Then, enter the following KQL (Kusto Query Language) code to retrieve and process your data
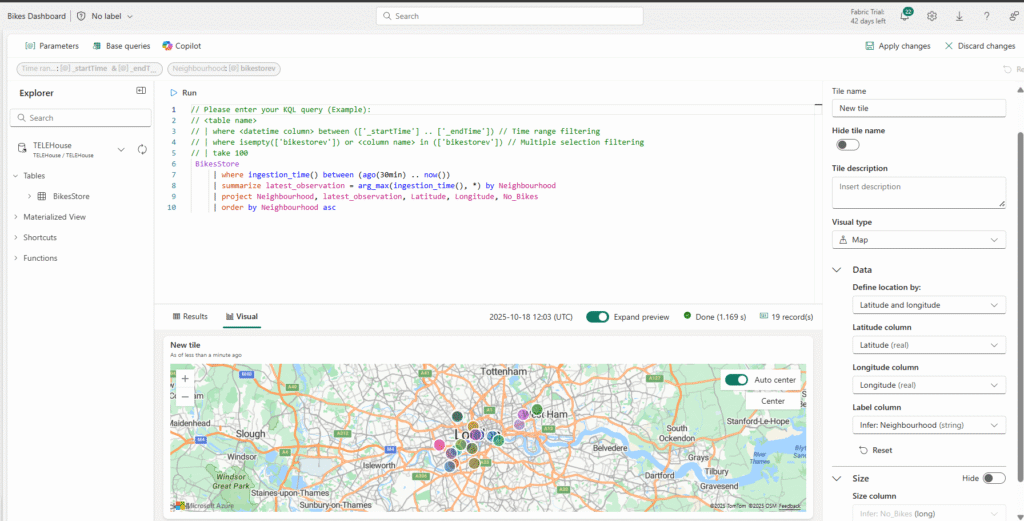
Visualize Bike Locations on a Map
Now you’ll create a map visualization to show the real-time locations of bikes across neighborhoods.
Steps to Run the Query and Configure the Tile
- Run the Query
Execute a query that retrieves the location and number of bikes observed in each neighborhood over the last 30 minutes. - Apply Changes
Click Apply changes to update the dashboard. The data will appear in a table within the tile. - Edit the Tile
On the tile, click the Edit icon (shaped like a pencil) to open the Visual Formatting pane. - Configure Map Visual Settings
Set the following properties:- Tile name: Bike Locations
- Visual type: Map
- Define location by: Latitude and Longitude
- Latitude column: Latitude
- Longitude column: Longitude
- Label column: Neighbourhood
Once applied, your tile will display a real-time map showing bike locations across neighborhoods, with labels for easy identification.
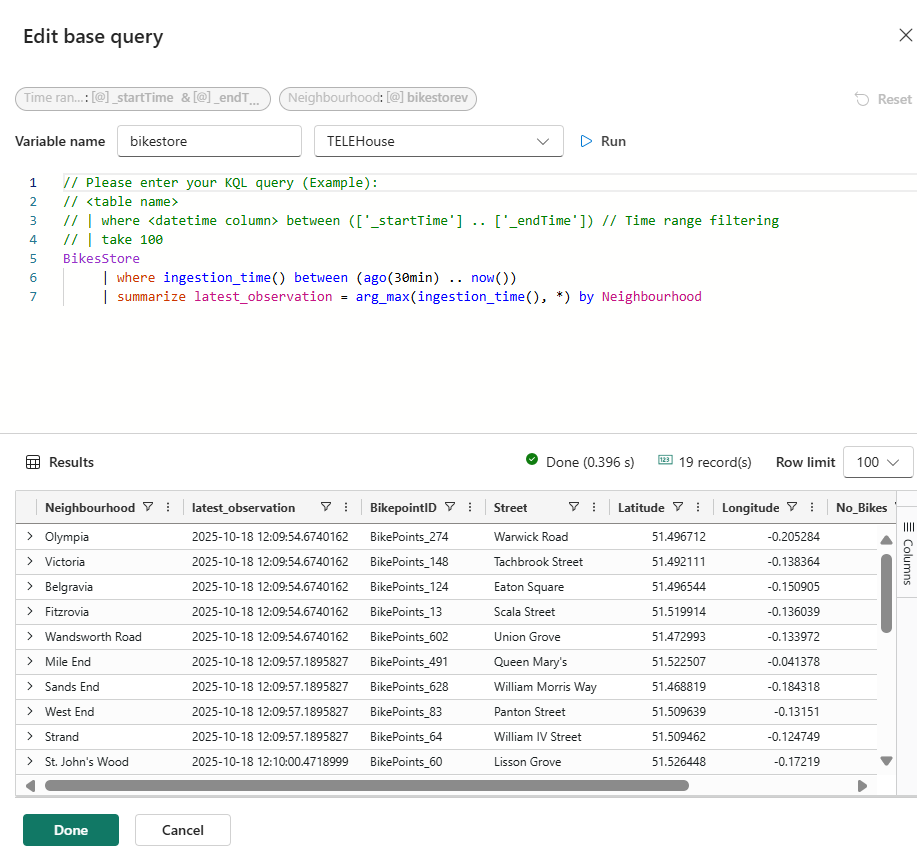
If your dashboard contains multiple visuals that use similar queries, it’s a good practice to consolidate the shared data into a single base query. This reduces duplication and makes your dashboard easier to maintain.
Steps to Create a Base Query
- Open Base Queries
In the dashboard toolbar, select Base queries, then click + Add. - Configure the Base Query
In the base query editor:- Set the Variable name to
base_bike_data - Ensure the Bike Store source is selected
- Set the Variable name to
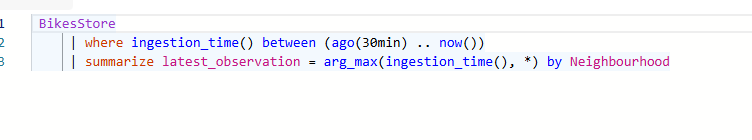
- Enter Your Query
Input the query that consolidates the common data used by your dashboard visuals.
Once created, your base query will serve as a shared data source, streamlining your real-time dashboard and improving maintainability.
BikesStore
| where ingestion_time() between (ago(30min) .. now())
| summarize latest_observation = arg_max(ingestion_time(), *) by Neighbourhood
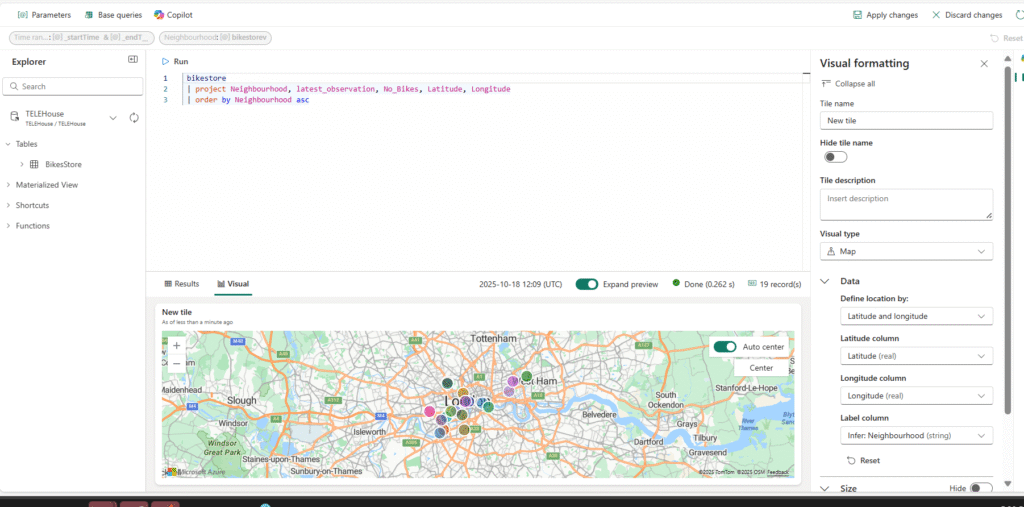
bikestore
| project Neighbourhood, latest_observation, No_Bikes, Latitude, Longitude
| order by Neighbourhood asc
Add a Parameter to Filter by Neighbourhood
Currently, your dashboard displays the latest bike, dock, and location data for all neighborhoods. To make it more interactive, you can add a parameter that allows users to select specific neighborhoods.
Steps to Add a Parameter
- Open the Parameters Pane
On the dashboard toolbar, go to the Manage tab and select Parameters. - Remove Existing Parameters
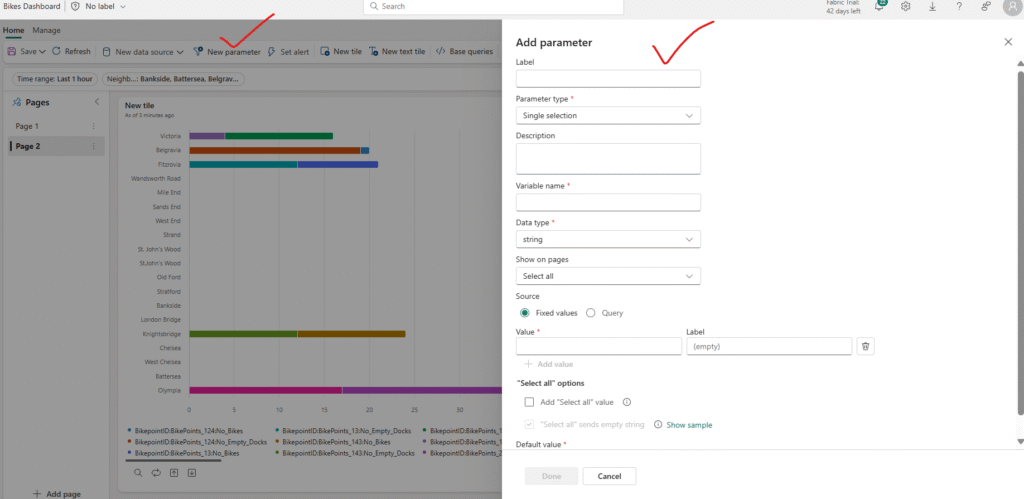
Check for any automatically created parameters (e.g., a Time range parameter) and delete them to avoid conflicts. - Add a New Parameter
Click + Add and configure the parameter with the following settings:- Label: Neighbourhood
- Parameter type: Multiple selection
- Description: Choose neighbourhoods
- Variable name:
selected_neighbourhoods - Data type: String
- Show on pages: Select All
- Source: Query
- Data source: Bikestore
Once added, this parameter allows users to dynamically filter the dashboard visuals by selected neighborhoods, making your real-time insights more targeted and interactive.
Now that you’ve created the Neighbourhood parameter, you can use it to dynamically filter your dashboard visuals.
Steps to Apply the Parameter
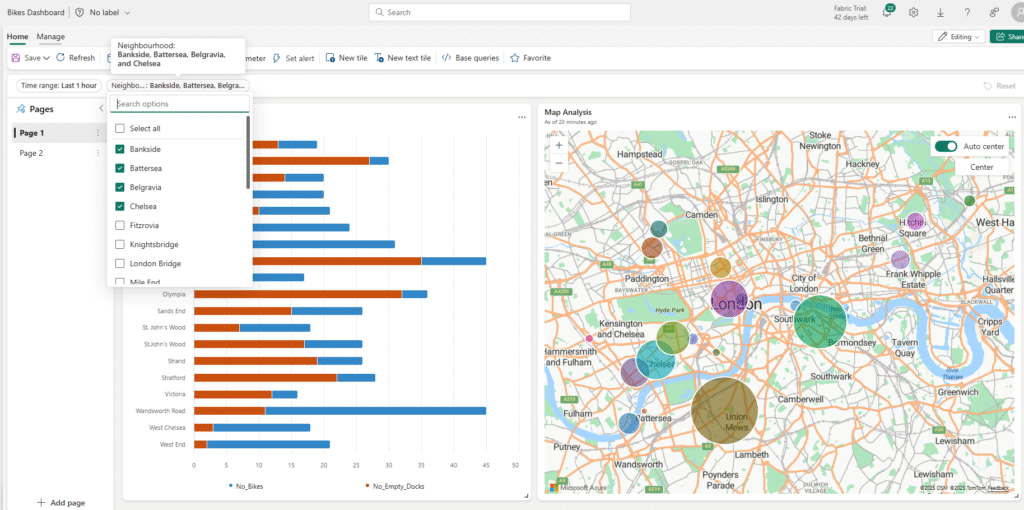
- Select the Parameter
On your dashboard, locate the Neighbourhood parameter control. - Filter by Selected Neighbourhoods
Choose one or more neighborhoods from the parameter. - Update the Visuals
The dashboard will automatically filter the data in all linked visuals, showing only the bike, dock, and location information for the neighborhoods you selected.
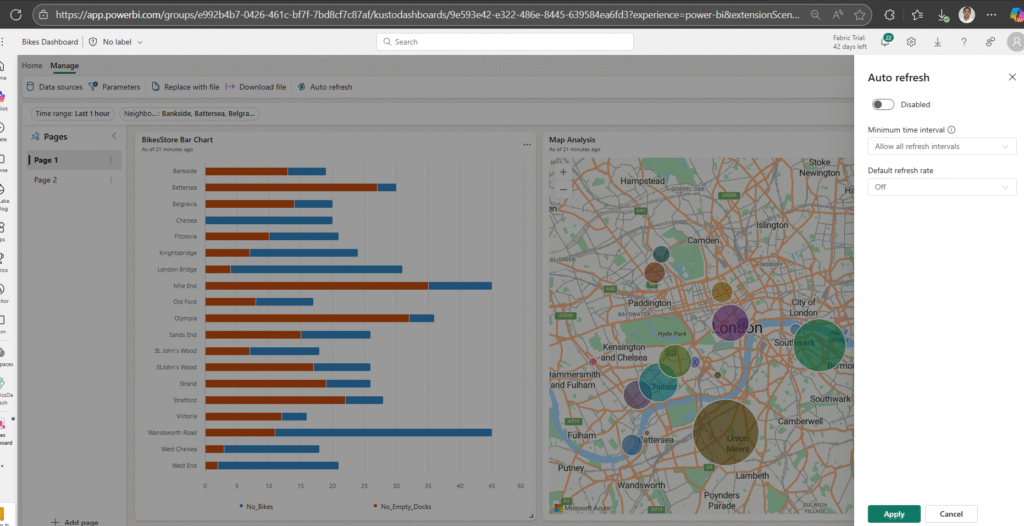
Configure Auto-Refresh for Your Dashboard
While users can manually refresh the dashboard, enabling auto-refresh ensures that your real-time data stays up-to-date without any manual intervention.
Steps to Enable Auto-Refresh
- Open Auto-Refresh Settings
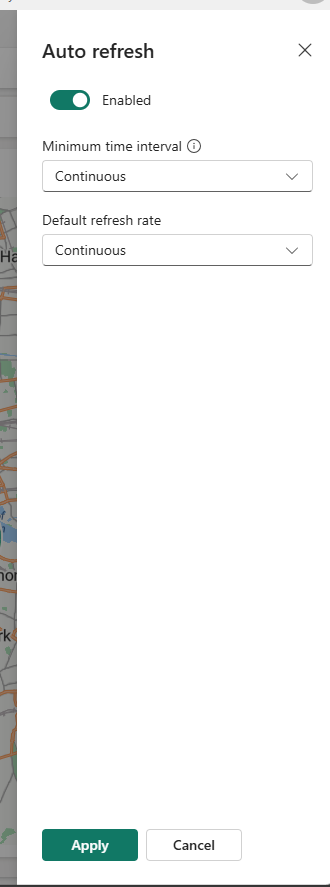
On the dashboard toolbar, go to the Manage tab and select Auto refresh. - Configure the Refresh Options
In the Auto refresh pane, set the following:- Enabled: Selected
- Minimum time interval: Allow all refresh intervals
- Default refresh rate: 30 minutes
- Apply the Settings
Click Apply to enable automatic refresh. Your dashboard will now update at the specified interval, keeping all visuals current with the latest data.
Save and Share Your Dashboard
Once your real-time dashboard is complete, you can save it and share it with other users to enable collaborative insights.Steps to Save and Share
- Save the Dashboard
On the dashboard toolbar, click Save to store your work. - Share the Dashboard
After saving, select Share.
In the Share dialog box, click Copy link to copy the dashboard URL to your clipboard. - Access the Shared Dashboard
Open a new browser tab and paste the copied link to navigate to the shared dashboard.
Sign in with your Fabric credentials if prompted. - Explore the Dashboard
Use the dashboard to view the latest information about bikes and empty bike docks across the city. Your visuals will update in real time, giving users instant insights into the current status of bike availability.
Conclusion
As we see Now we have built a real-time dashboard in Microsoft Fabric — from creating a workspace and setting up eventstreams, to visualizing live data and enabling interactive filters and auto-refresh. With these dashboards, you can monitor bike availability, empty docks, and locations across neighborhoods instantly, empowering smarter, data-driven decisions.We hope this tutorial helps you get started with real-time data visualization in Microsoft Fabric.
💡 Happy reading! If you found this guide helpful, feel free to share your thoughts or leave a comment below. We’d love to hear your feedback and experiences as you explore real-time dashboards!
I really like looking through and I conceive this website got some truly useful stuff on it! .